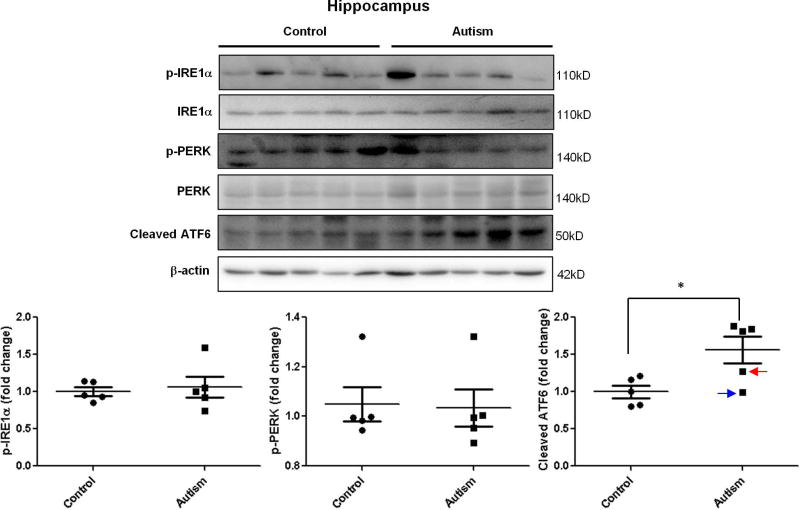
Figure 2.
Immunoblot analysis of ER stress signals in the autistic hippocampus. Immunoblot analysis of the hippocampus homogenate was performed using p-IRE1α, p-PERK and total ATF6 antibodies. Representative images of the immunoblots are shown in the top panel. The blue arrow indicates sample #4849 and the red arrow indicates sample # 5565. The quantification of immunoblots normalized to β-actin is shown by bar graphs. Values are the means ± SEM (n=5). * indicates a significant difference in autistic brains compared to controls (P < 0.05).

