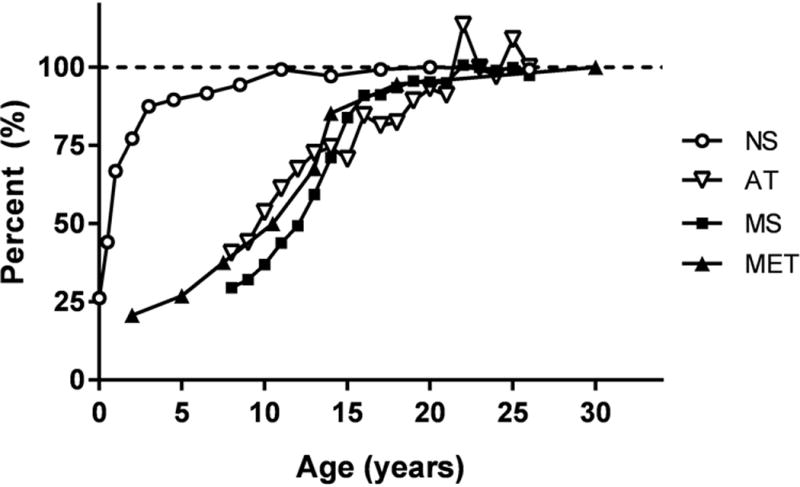
Figure 2.

Plot of data from Scammon (37) showing percentage of adult male nervous, musculoskeletal, and metabolic system, and adipose tissue mass (NS, MS, MET, AT) achieved as a function of age. NS, represented by brain mass (36); MS, by appendicular lean soft tissue and bone mineral mass (30); MET, by LV mass (49); and AT by fat mass (30). A horizontal dashed line is placed at 100% growth. Details of the samples and measurement methods used to create the plots are provided in Supplementary Material VI. Qualitatively similar growth patterns are observed in females.
