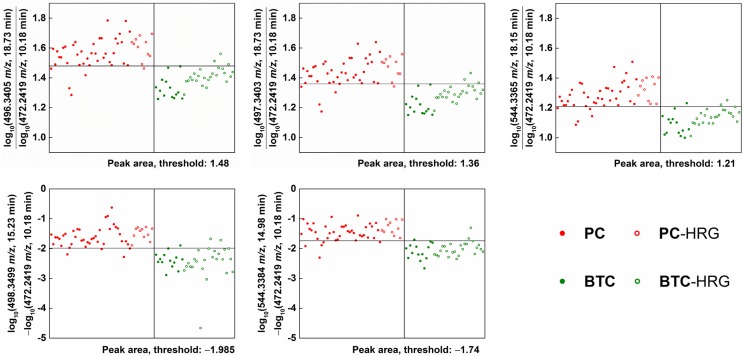
Fig. 2.
LMI pairs discriminating the PC from BTC groups. The mass peak areas of the selected LMIs were converted to logarithms, and the relative ratio or difference of each LMI pair showed great performance (combined sensitivity / specificity > 90%) in discriminating between PC and BTC. The horizontal line denotes the corresponding discrimination threshold. Overall, the logarithmic peak areas of the numerator or minuend LMIs were higher in the PC group than in the BTC group and the reverse was true for denominator or subtrahend LMIs. LMI, low-mass ion; PC, pancreatic cancer; BTC, biliary tract cancer; HRG, high-risk group

