Fig. 6.
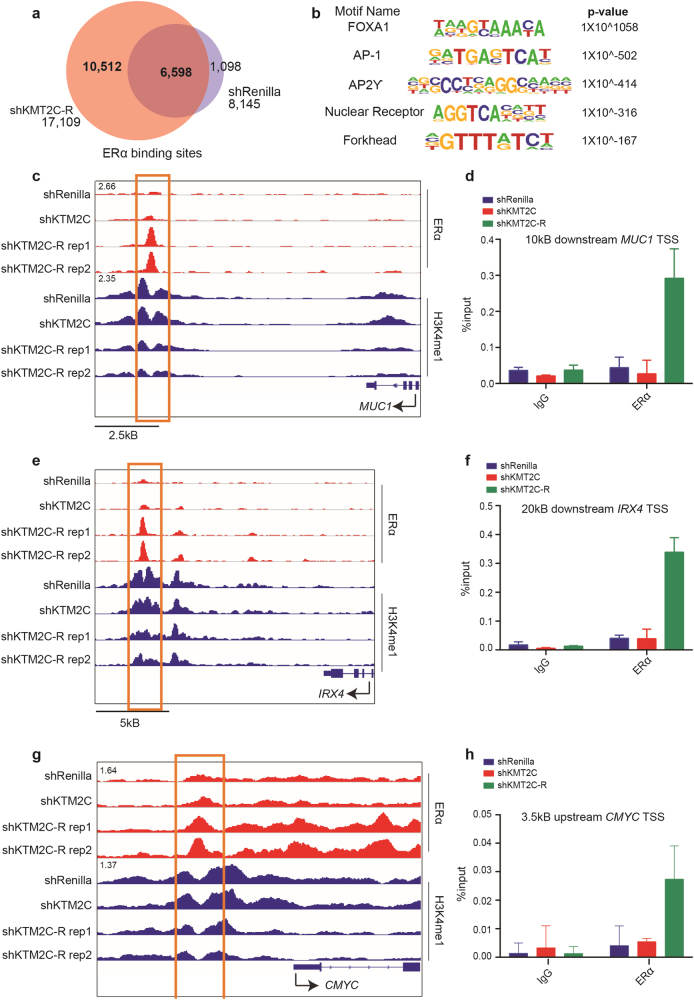
ERα is reprogrammed in shKMT2C-R cells. a Venn diagram showing overlap between shKMT2C-R (in CSS, red) and shRenilla (in full serum, purple) ERα binding sites. b HOMER motif analysis at the 10,512 novel ERα loci in shKMT2C-R. Full list in Fig. S17. c, e, g IGV browser views for ERα in shRenilla and shKMT2C-R cells. Sites of increased ERα binding outlined in orange. For CMYC, orange outline encompasses a previously defined AP-1 dependent ERα site [34]. d, f, h qChIP analysis. IgG used as negative control. Values correspond to mean percentage of input ± s.e.m. of triplicate qPCR reactions of a single replicate. Data correspond to one representative assay from a total of two independent assays

