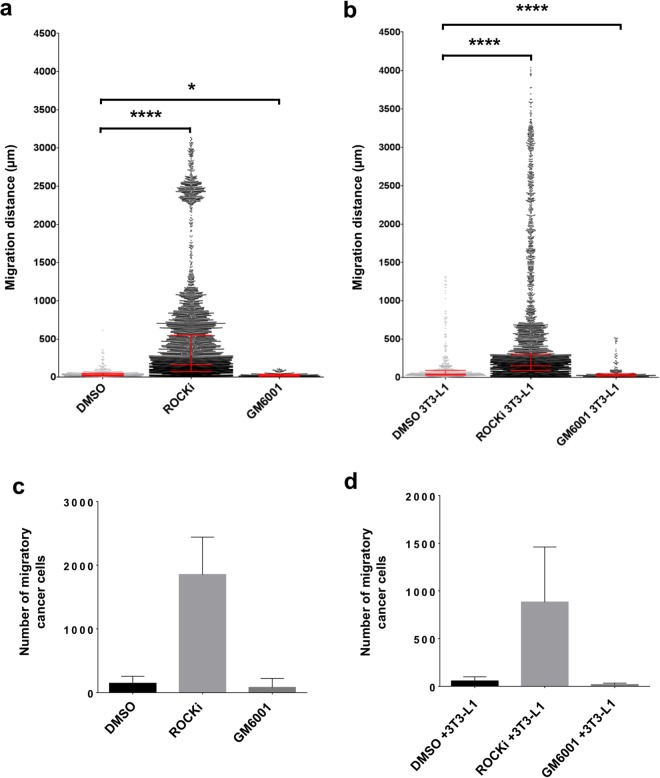
Figure 6.
Analysis of tumour cell migration and response to pathway inhibitors (10 days). Comparison of Wnt1 tumour cell migratory distance, from the anisotropic collagen scaffold nucleation point to within the scaffold, after 72 hours culture in the absence (a) or presence (b) of differentiated 3T3-L1 cells (known as ET-SIM), with/without pathway inhibitors ROCKi, GM6001 and Canertinib, all statistically compared to DMSO (vehicle control). The total number of migratory Wnt1 tumour cells within the scaffolds, in the absence (c) or presence (d) of differentiated 3T3-L1 cells (known as ET-SIM), with/without the pathway inhibitors ROCKi, GM6001 and Canertinib compared to DMSO (vehicle control). The following statistical analyses were applied: non-parametric unpaired/matching Kruskal-Wallis ANOVA with a Geisser-greenhouse correction combined with a Dunn’s multiple comparison test, *p < 0.05, ****p < 0.0001. Sample size n = 4.

