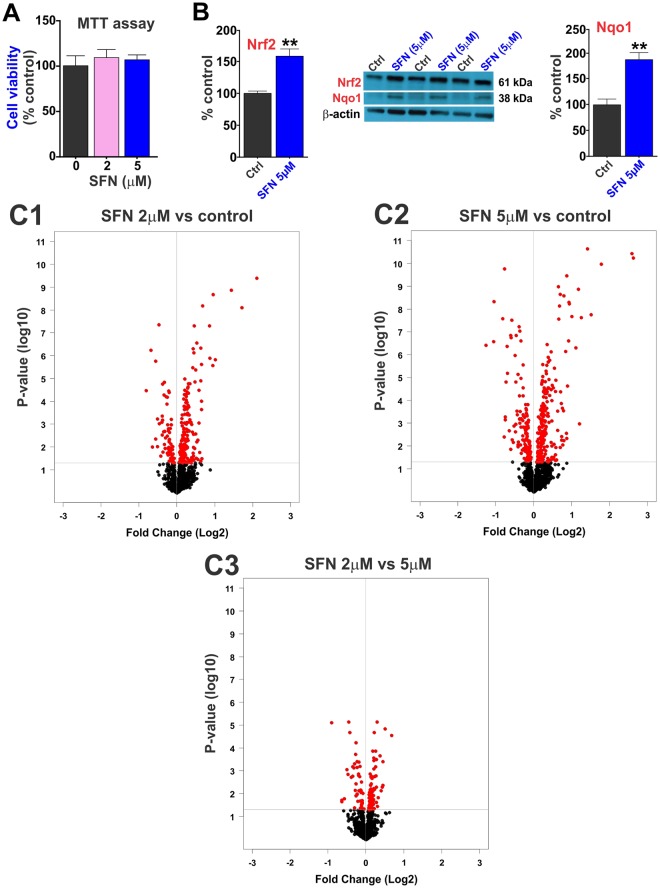
Figure 1.
SFN impact on mitochondria-related gene expression. (A1) Cell viability was not affected by SFN (5 µM) as determined by MTT assay. (A2) SFN treatment upregulates the expression level of Nrf2 and its downstream target Nqo1 in mice brain microvascular endothelial cells. (B1–B3) Volcano plots of gene expression in response to different concentration of SFN (B1) 2 µM vs. control; (B2) 5 µM vs control and (B3) 2 vs. 5 µM) as analyzed by MitoChip microarray in primary cells. Horizontal line represents p = 0.05. Genes with expression not significantly altered are indicated by solid black circles and genes with expression significantly altered are indicated by solid red circles. Significantly down-regulated genes are in the upper left quadrant and significantly up-regulated genes are in the upper right quadrant. N = 3–4 independent biological samples per condition repeated in triplicates. Blots of Nrf2, Nqo1 and β-actin were taken from different gels.

