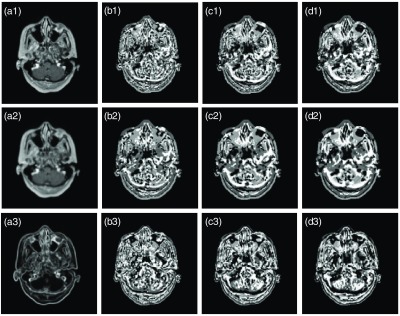
Fig. 2.

Example of 3-D RILBP feature maps. The (a1–a3) are the image sets including original MRI image, mean of MRI and standard division of MRI. The corresponding feature maps are in the (b1–b3), (c1–c3), and (d1–d3). In (b1–b3), a sphere with radius 3 mm and cubes of size were used. In (c1–c3), the sphere radius was 5 mm and cube size was . In (d1–d3), the sphere radius was 7 mm and cube size was .
