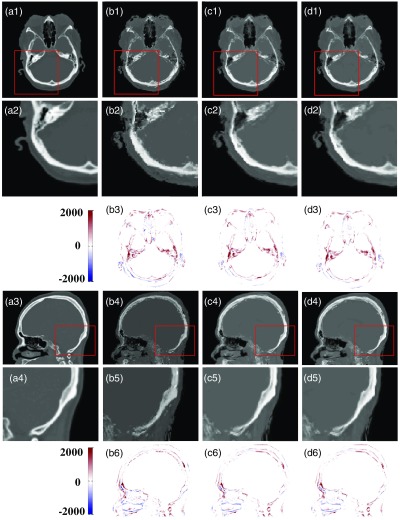
Fig. 6.
Comparison of the PCT estimated by CF, FS, and FSJDL, (a1) and (a3) ground truth CT, (b1–d1) and (b4–d4) are the PCT result generated by CF, FS, and FSJDL, respectively. (a2–d2) The zoomed regions indicated by solid red boxes in (a1–d1); (a4–d4) are the zoomed regions indicated by solid red boxes in (a3–d3). (b3–d3) are difference image between ground truth (a1) and the PCT estimated by CF, FS, and FSJDL. (b6–d6) Difference image between ground truth (a3) and the PCT generated by CF, FS, and FSJDL.

