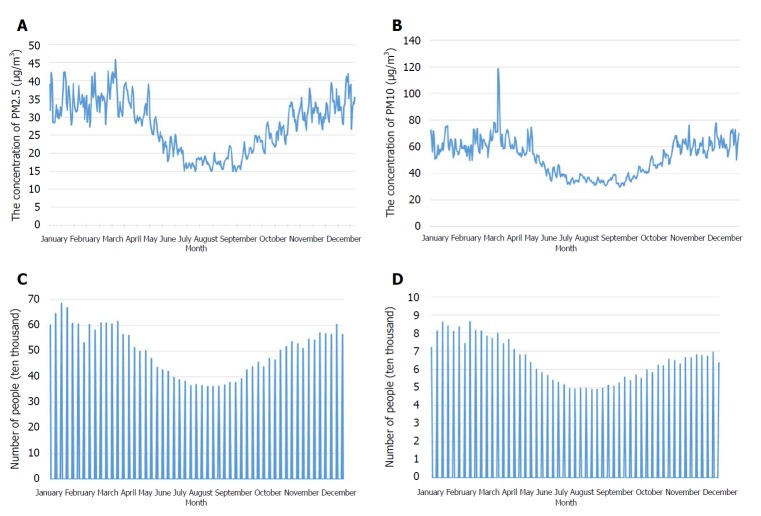
Figure 2.
The average daily concentrations and weekly numbers of outpatient visits for upper respiratory tract infections in each month. A and B: PM2.5 and PM10, repectively (December 2008 - December 2016); C and D: The overall and the elderly patients, repsectively (January 2009 - December 2016). PM: Particulate matter.

