
Figure 4.
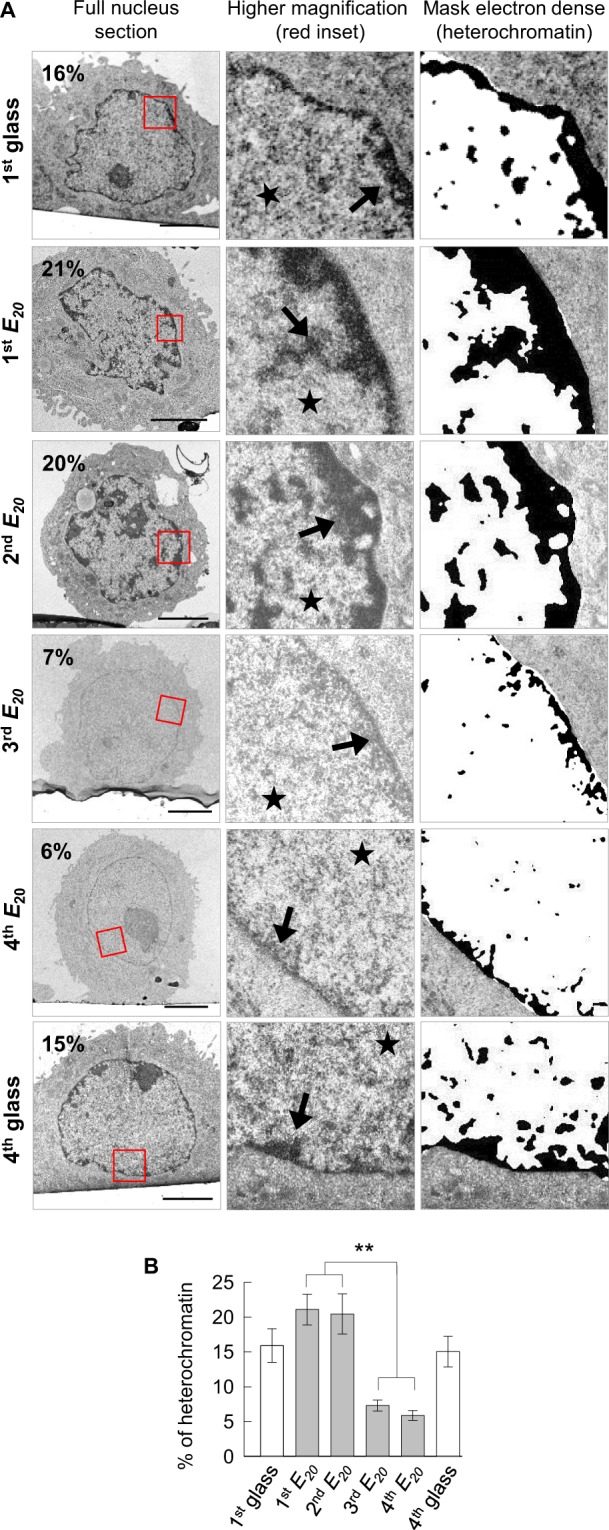
Chromatin de-condensation by switching the substrate elasticity (A) Representative ultrastructural images of cells after 24 h of culture on 1st glass, 1st E20, 2nd E20, 3rd E20, 4th E20, and 4th glass. Scale bars: 5 µm, arrow: heterochromatin, star: euchromatin, (B) Percentage of heterochromatin in the nucleus of approximately 20 cells for each condition, from A, for two pooled independent experiments (error bars represents s.e.m.).