Figure 1.
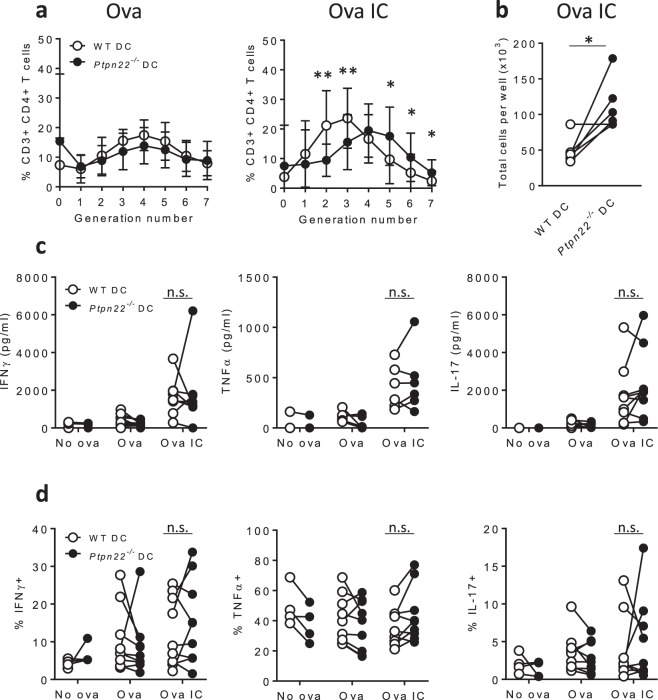
Ptpn22−/− BMDCs enhance immune complex induced T cell proliferation. (a–d) WT or Ptpn22−/− BMDCs were pulsed overnight in the presence of ova or ova IC prior to co-culture with CTV labelled WT CD4+ OT-II T cells for 6 days. (a) Proportions of WT OT-II T cells in each generation of cell division after 6 days of co-culture with ova (left) and ova IC (right) pulsed WT (white) or Ptpn22−/− (black) BMDCs (gated on live, CD3+, CD4+ singlets). n = 10 ± s.d.; **p < 0.01, *p < 0.05 using a Wilcoxon matched-pairs signed ranks test. (b) The number of cells per well were counted using trypan blue after 6 days of co-culture with ova IC pulsed WT (white) or Ptpn22−/− (black) BMDCs. n = 6; *p < 0.05 using a paired t-test. (c) At day 6 of co-culture cell-free supernatants were assessed for IFNγ (left), TNFα (middle) and IL-17 (right) by immunoassay. n = 3–10. (d) At day 6 T cells co-cultured with ova or ova IC pulsed WT (white) or Ptpn22−/−(black) BMDCs were restimulated for 6 hours with PMA and ionomycin in the presence of monensin and intracellular expression of IFNγ (left), TNFα (middle) and IL-17 (right) was determined in live, CD3+, CD4+ singlets by flow cytometry. n = 4–9. Connecting lines indicate WT or Ptpn22−/− BMDCs co-cultured with the same WT OT-II T cells. n.s. = not significant using a 2-way ANOVA.

