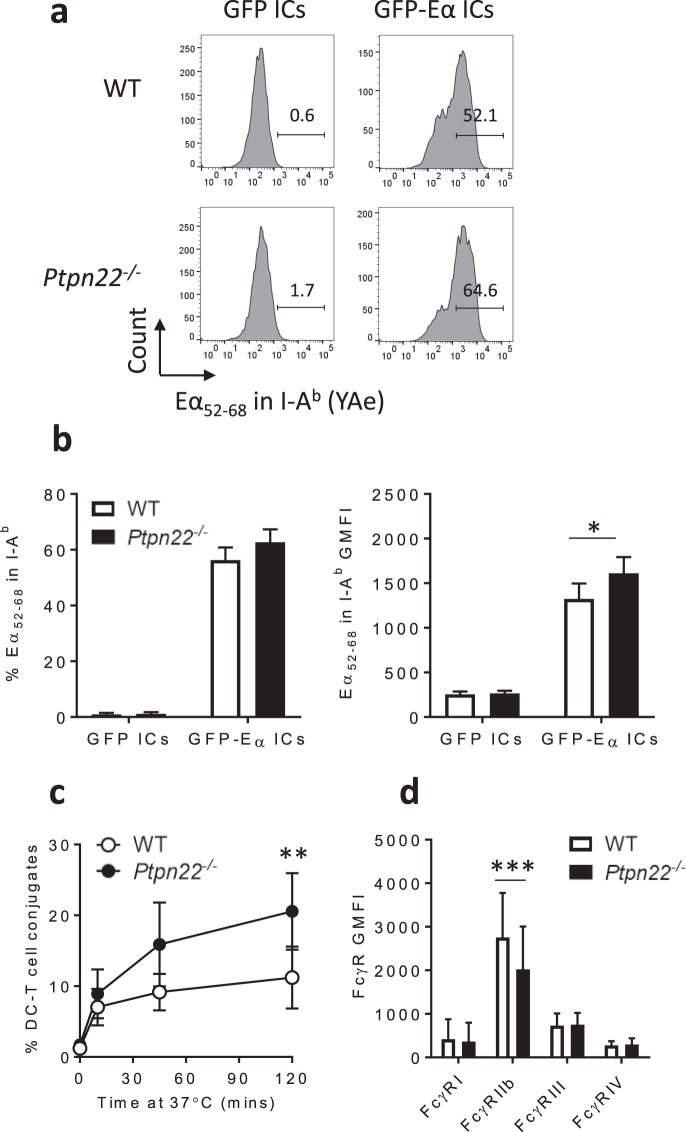
Figure 4.
Ptpn22−/− BMDCs present more immune complex derived antigens and form more conjugates with T cells. (a) Representative flow cytometry plots of Eα52–68 surface expression in I-Ab by WT (top) and Ptpn22−/− (bottom) BMDCs after 18 hour incubation with GFP:anti-GFP ICs (left) and GFP-Eα:anti-GFP ICs (right). (b) Combined proportion (left) and geometric mean fluorescence intensity (GMFI, right) of Eα52–68 surface expression in I-Ab by WT (white) and Ptpn22−/− (black) BMDCs after 18 hour incubation with GFP:anti-GFP ICs and GFP-Eα:anti-GFP ICs (gated on live, CD11c+ singlets). n = 3 + s.d.; *p < 0.05 using a 2-way ANOVA with Sidak’s multiple comparisons test. (c) Proportion of WT OT-II T cells in conjugates with ova IC pulsed WT (white) and Ptpn22−/− (black) BMDCs over time. Conjugates were identified as CTV+ CTFR+ events (%, gated on CTV+ total T cells). n = 4 ± s.d.; **p < 0.01 using a 2-way ANOVA with Sidak’s multiple comparisons test. (d) Cell surface FcγR expression on WT (white) and Ptpn22−/− (black) BMDCs (gated on live, CD11c+ singlets). n = 16 + s.d.; ***p < 0.005 using a 2-way ANOVA with Sidak’s multiple comparisons test.

