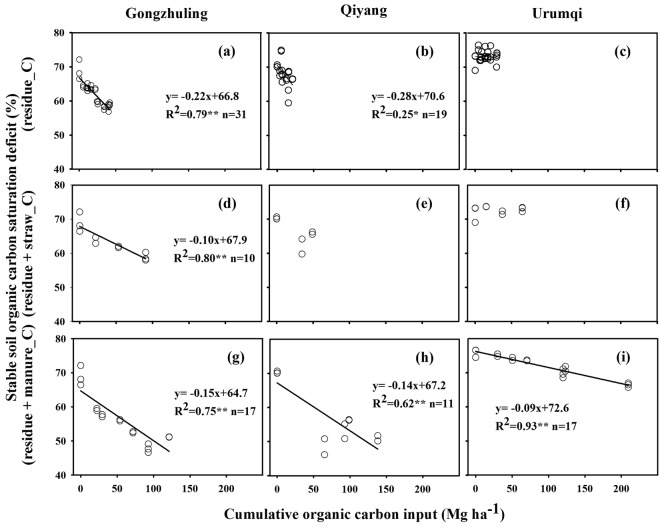
Figure 4.
Relationship of the stable C saturation deficit with different ranges and different types of cumulative C input derived from residue-C under CT, N, NP and NPK treatments (a–c); residue plus straw-C under NPKS (d–f); and residue plus manure-C under NPKM and hNPKM (g–i) over 17 years of fertilization at the three long-term sites (P < 0.01 denoted by two asterisks and P < 0.05 denoted by one asterisks). CT, non-fertilized control; N, mineral nitrogen; NP, mineral N and phosphorus; NPK, mineral N, phosphorus, and potassium combination; NPKS, NPK plus crop straw return; NPKM, NPK plus livestock manure; hNPKM, higher rates of mineral fertilizer and manure input.

