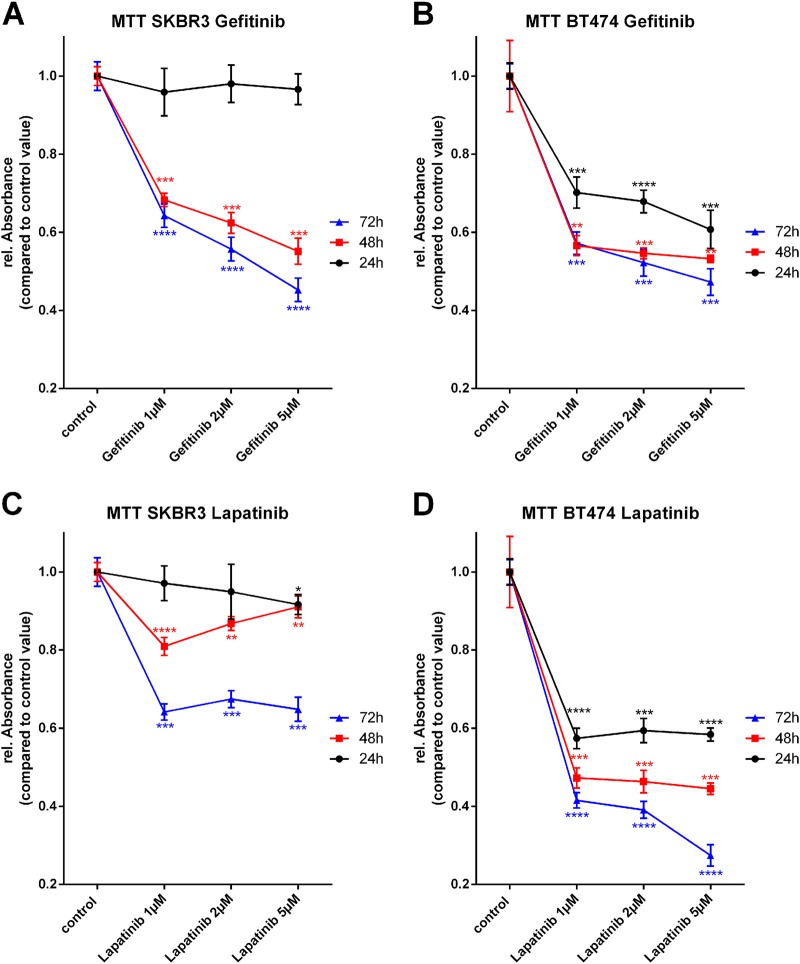
Fig. 1. Mitochondrial metabolic rate under the influence of Gefitinib and Lapatinib.
SK-BR3 cells treated with the indicated concentrations of Gefitinib over a time period of 24 h, 48 h, or 72 h (a). BT474 cells treated with the indicated concentrations of Gefitinib over a time period of 24 h, 48 h, or 72 h (b). SK-BR3 cells treated with the indicated concentrations of Lapatinib over a time period of 24 h, 48, or 72 h (c). BT474 cells treated with the indicated concentrations of Lapatinib over a time period of 24 h, 48 h, or 72 h (d). (N = 3)

