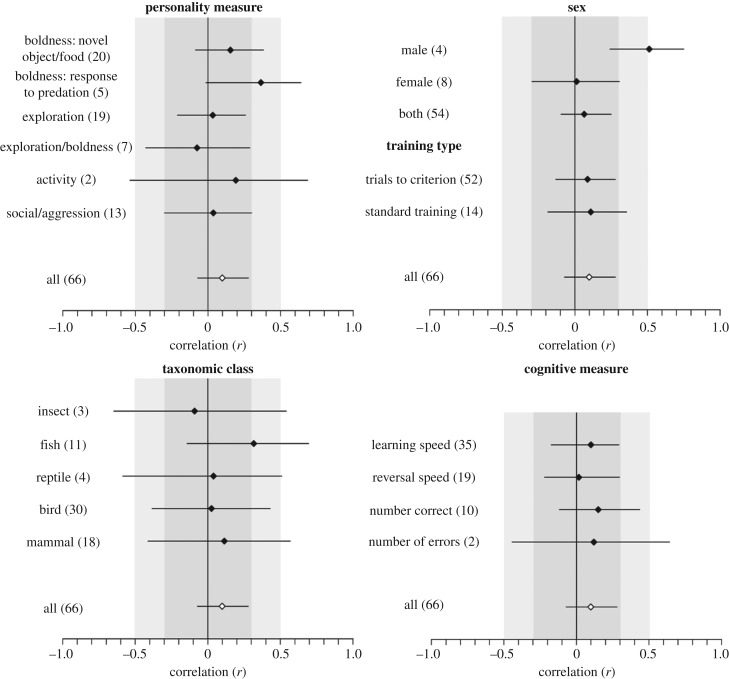
Figure 4.
Mean effect size estimates (r) and HPD interval for each moderator category. Numbers in parentheses show the number of effect sizes for each category. Estimates come from meta-regression models including three random factors (study, species and phylogeny) and a single fixed factor, with models run separately for each moderator variable. The overall mean effect size for the entire dataset is represented by a white diamond in each plot for comparison. Shading corresponds to benchmark values for small (dark grey; less than 0.3), medium (light grey; 0.3–0.5) and large (white; greater than 0.5) effects.

