Figure 1.
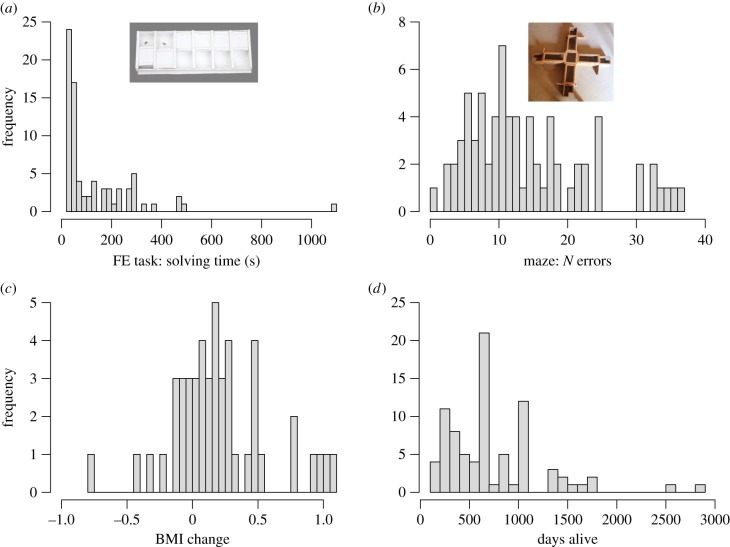
Inter-individual variation in performance in two cognitive tests and two fitness proxies. Depicted are histograms of the two main cognitive measures, (a) solving time of the FE task and (b) number of errors made until the learning criterion in the maze, and the two fitness proxies, (c) BMI change and (d) days alive. (Online version in colour.)

