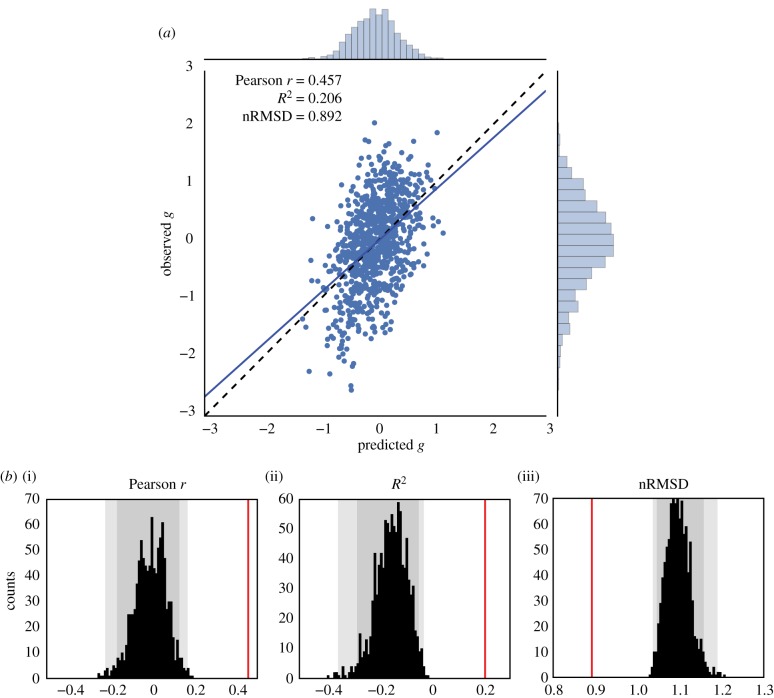
Figure 2.
Prediction of the general factor of intelligence g from resting-state functional connectivity, averaging all resting-state runs for each subject (REST12, totalling almost 1 h of fMRI data). (a) Observed versus predicted values of the general factor of intelligence. The regression line had a slope close to 1, as expected theoretically [95]. The correlation coefficient was r = 0.457 (REST1 only, r = 0.419; REST2 only, r = 0.312). (b) Evaluation of prediction performance according to several statistics and their distributions under the null hypothesis, as simulated through permutation testing (with 1000 surrogate datasets). All fit statistics (red lines) fell far out of the confidence intervals under the null hypothesis. (i) The correlation between observed and predicted values; (ii) the coefficient of determination R2, interpretable as the proportion of explained variance; (iii) the nRMSD, which indicates the average difference between observed and predicted scores. Faint grey shade: p < 0.05; darker grey shade: p < 0.01, permutation tests.

