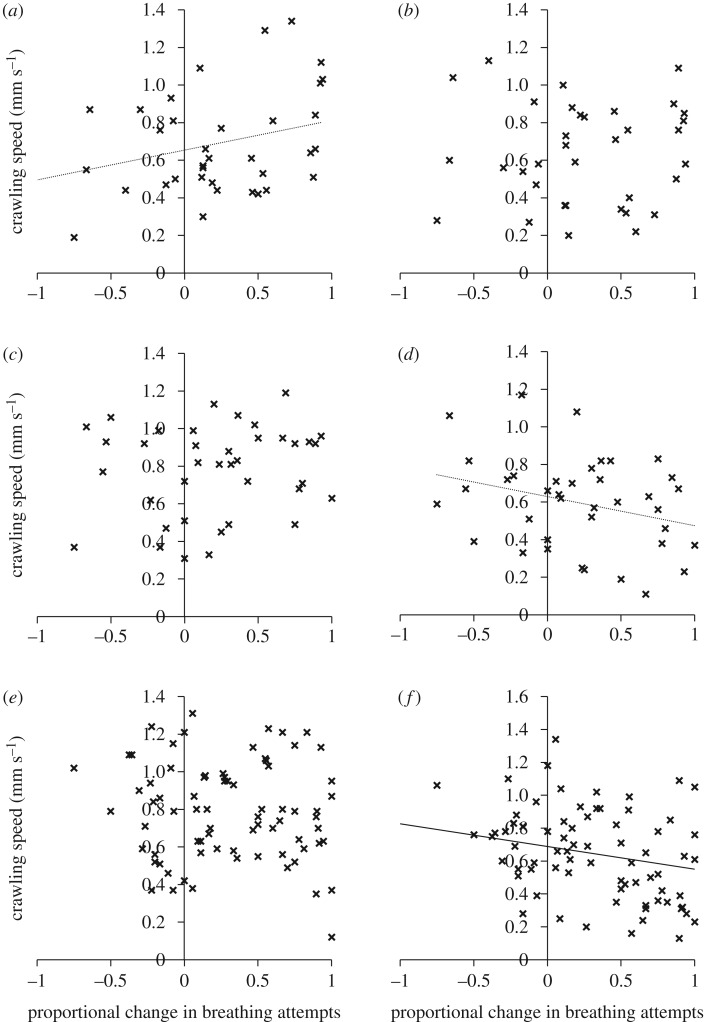
Figure 2.
Relationship between crawling speed (mm s−1) and memory formation as proportional change in breathing attempts between the first training session and long-term memory test (converted to a positive value: higher value = greater decline in breathing attempts) in: (a) grouped laboratory strains; (b) isolated laboratory strains; (c) grouped ditch populations; (d) isolated ditch populations; (e) grouped river populations; and (f) isolated river populations. Trend lines are placed on the figure where the relationship is significant (solid line: p < 0.05) or show a non-significant trend (dotted line: p < 0.10).

