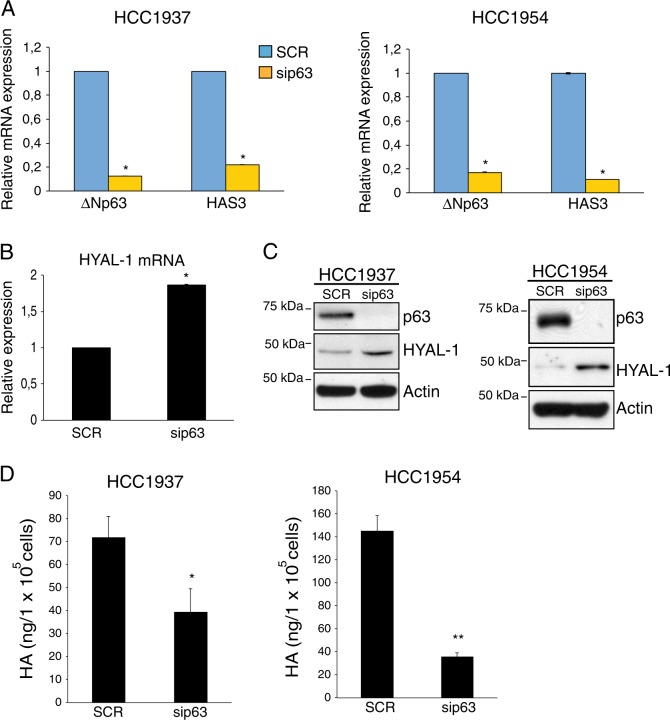
Fig. 1. p63 sustains the HA metabolism by controlling the expression of the HA-related genes HAS3 and HYAL-1.
a HCC1954 and HCC1937 breast carcinoma cell lines were grown in RPMI-1640 medium (Gibco, Invitrogen); H1299 cells (non-smal cell lung cancer cell line) were cultured in Dulbecco’s modified Eagle’s medium (Gibco, Invitrogen) supplemented with 10% v/v fetal bovine serum (FBS), 100 µg/mL penicillin and 100 µg/mL streptomycin (Gibco, Invitrogen). Cells were cultured at 37 °C with 5% CO2. Breast carcinoma cell lines were purchased from ATCC and routinely tested for mycoplasma contaminations. HAS3 and ΔNp63 mRNA levels were quantified by Real-Time PCR analysis (qRT-PCR) in the indicated basal-type breast tumor cell lines transfected with scrambled (SCR) or p63 siRNA (sip63) oligos. For siRNA oligos transfection cells were seeded at a density of 1.4 × 10⁵ cells/well in a six-well plate and transfected with oligos using RNAimax (Invitrogen) according to manufacturer’s instructions. Smart pool siRNA oligos direct against p63, HAS3 mRNA, and non-relevant gene (scramble) were purchased by Dharmacon (Thermo Scientific). Cells were collected 48 h after transfection and lysates were subjected to qRT-PCR analysis. Total mRNA was isolated using the RNeasy mini kit (Qiagen, Duesseldorf, Gemrany) following the manufacturer’s recommendations. Total RNA was quantified using a NanoDrop Spectophotometer (Thermo Scientific, Delaware, USA) and used for cDNA synthesis using Superscript Reverse Transcriptase (Promega, Fithburg, WI, USA), according to the manufacturer’s protocol. cDNA was subsequently used for qRT-PCR. Each 25 µl reaction contained 2X SYBR-Green PCR Master Mix (Promega), 2 µl cDNA and the appropriate specific primers (0.5 µM). Amplification and fluorescence detection according to the manufacturer’s instructions was performed using the ABI PRISM 7700 Sequence Detection System (Applied Biosystems, France). The expression of each gene was defined from threshold cycle (Ct), and the relative expression levels were calculated using the 2-ΔΔCt method. The primers used for qRT-PCR are the following: human ΔNp63 for 5′-GAAGAAAGGACAGCAGCATTG-3′; rev 5′-GGGACTGGTGGACGAGGAG-3′; human HAS3 for 5′-TGTGCATTGCCGCATACC-3′; rev 5′-CCGAGCGCAGGCACTT-3′; human GAPDH for 5′-AGCCACATCGCTCAGACA-3′; rev 5′-GCCCAATACGACCAAATC-3′; human Actin for 5′-GTTGCTATCCAGGCTGTG-3′; rev 5′-AATGTCACGCACGATTTCCCG-3′; Bars represent the mean of three technical replicates (n = 3, PCR runs) ± SD and are representative of three independent experiments (n = 3 biological replicates). No data were excluded form the analysis. *p- value < 0.05. b HYAL-1 mRNA levels were measured by qRT-PCR in HCC1937 cells transfected as in a. The following oligos were utilized for HYAL-1 mRNA expression analysis: human HYAL-1 for 5′-CGATATGGCCCAAGGTTTAG-3′; rev 5′-ACCACATCGAAGACACTGACAT-3′. Bars represent the mean of three technical replicates (n = 3, PCR runs) ± SD and are representative of two independent experiments (n = 2 biological replicates). No data were excluded form the analysis. *p- value < 0.05. c Total protein lysates extracted by the HCC1937 and HCC1954 cells transfected as in a were analyzed by immunoblotting (IB) using antibodies to the indicated proteins. IB was performed as previously described68. The following antibodies were utilized: rabbit monoclonal anti p63-α D2K8X (Cell Signaling Technology); mouse monoclonal anti β-actin (AC-15) (Sigma-Aldrich) and rabbit polyclonal anti HYAL-1 (Sigma-Aldrich). d HCC1937 and HCC1954 cells (2 × 10⁵ cells/well) were transfected with scrambled (SCR) or p63 siRNA (sip63) oligos. Forty-eight hours after transfection growth medium of transfected cells was collected and extracellular hyaluronic acid (HA) levels were measured using Hyaluronan Enzyme-Linked Immunosorbent Assay Kit (HA-ELISA) (Echelon) following the manufacturer’s recommendations. The amount of hyaluronic acid (ng) was normalized per the number of cells (105 cells). Bars represent the mean of four replicates (n = 3) ± SD. *p-value < 0.05; **p-value < 0.01. Statistical evaluation was determined by using a two-tailed t-test.

