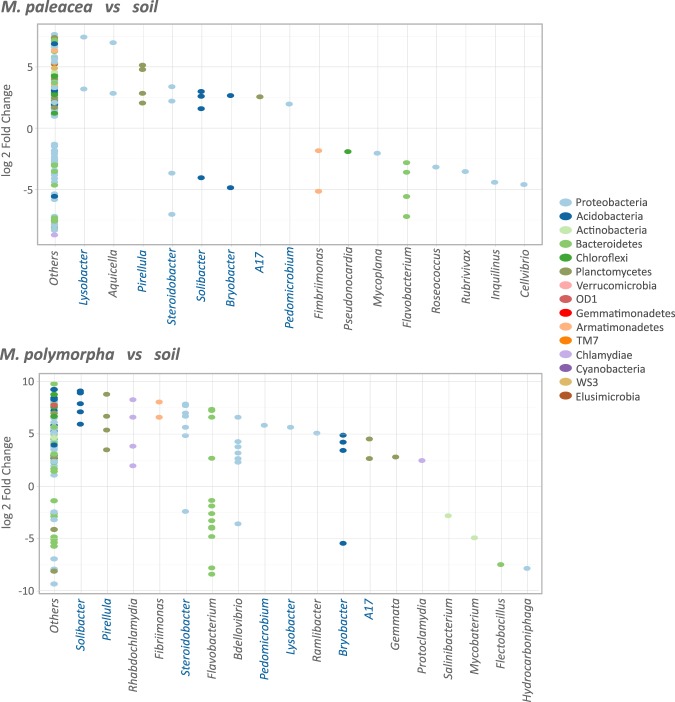
Figure 5.
Relative abundance of the bacteria associated with Marchantia. The genera with significant (padj = 0.01) log2 fold changes are shown. “Other” corresponds to OTUs whose genera could not be assigned. Each dot represents an OTU. The OTUs prevalent in the Marchantia species are located on top of the plot while the OTUs prevalent in soil are located at the bottom. The majority of the OTUs were not assigned to a known genus, and are shown as “Others” in the plots. Shared genera between both Marchantia species are highlighted in blue.

