Fig. 3.
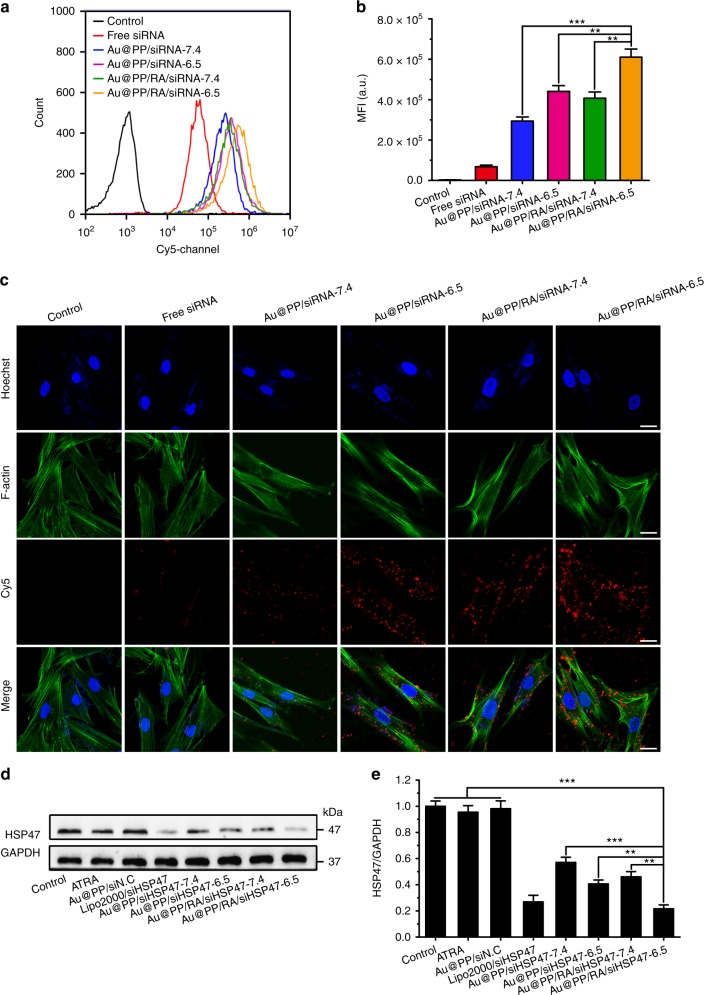
pHe and ATRA dual-enhanced cellular uptake and gene silencing. a Flow cytometry analysis of PSCs after incubation with Cy5-siRNA-loaded Au@PP or Au@PP/RA at pH 7.4 or 6.5 for 2 h. b The mean fluorescence intensity (MFI) of the different groups. The data are shown as the mean ± s.d. (n = 3). **p < 0.01, ***p < 0.001 (Student’s t test). c Confocal laser scanning microscopy images of PSCs after incubation with Cy5-siRNA (red) loaded formulations at pH 7.4 or 6.5 for 2 h. F-actin was labelled with phalloidin (green) and nuclei were labelled with Hoechst 33342 (blue). Scale bars, 20 μm. d Western blot analysis of HSP47 protein in PSCs after treatment with the indicated formulations for 48 h at pH 7.4 or 6.5. Lipofectamine 2000 transfection agent served as a positive control (Lipo2000/siHSP47). siN.C, negative control siRNA; siHSP47, HSP47 siRNA. e Quantitative analysis of the normalised HSP47 protein expression (using Image J software). The data are shown as the mean ± s.d. (n = 3). **p < 0.01, ***p < 0.001 (Student’s t test)

