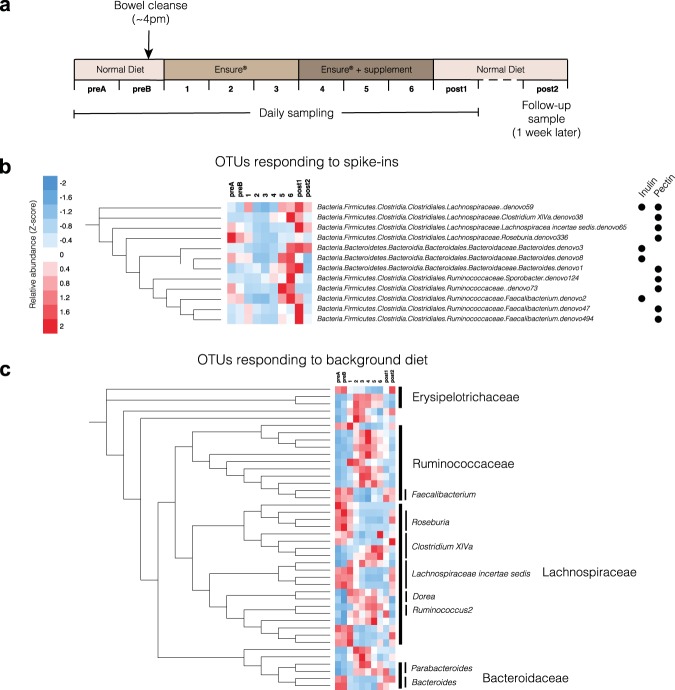
Figure 1.
Nutritional meal replacement and prebiotic spike-ins result in reproducible changes across participants. (a) Schematic outlining the dietary and sampling regimen for the study. (b) OTUs that showed statistically significant (DESeq. 2, FDR < 0.1) differential abundance on day 6 compared to day 3 in response to particular spike-ins. Mean relative abundances are computed across all participants and then converted to Z-scores across timepoints, to illustrate relative changes through time. (c) OTUs that showed statistically significant (Wilcoxon Rank-Sum test, FDR < 0.1; N = 39) differential abundance on day 3 compared to baseline (preB). Complete RDP taxonomies can be found in Fig. S1.

