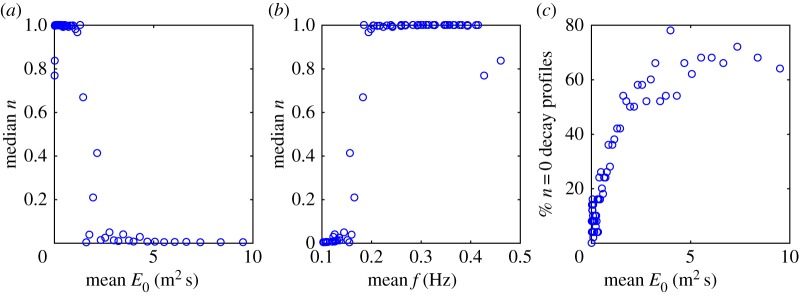
Figure 3.
Panel (a) shows n versus E0, created from clusters of E0 that each contain about 100 estimated values. Each point on the plot gives the mean of this sample of E0 values versus the median of the corresponding sample of n values. The transition between n = 1 and n = 0 occurs at E0∼1.5 m2s. The median of n versus the mean of the frequency calculated as the mean of all the frequency samples corresponding to the E0 samples in a bin is shown in (b). There is a dependence on frequency which follows closely the dependence on energy because the two are strongly correlated for f > 0.1 Hz in the spectral tail where E0∝f−4. (c) The percentage of profiles in each E0 bin where n = 0, i.e. the waves decay in direct proportion to the distance traversed.

