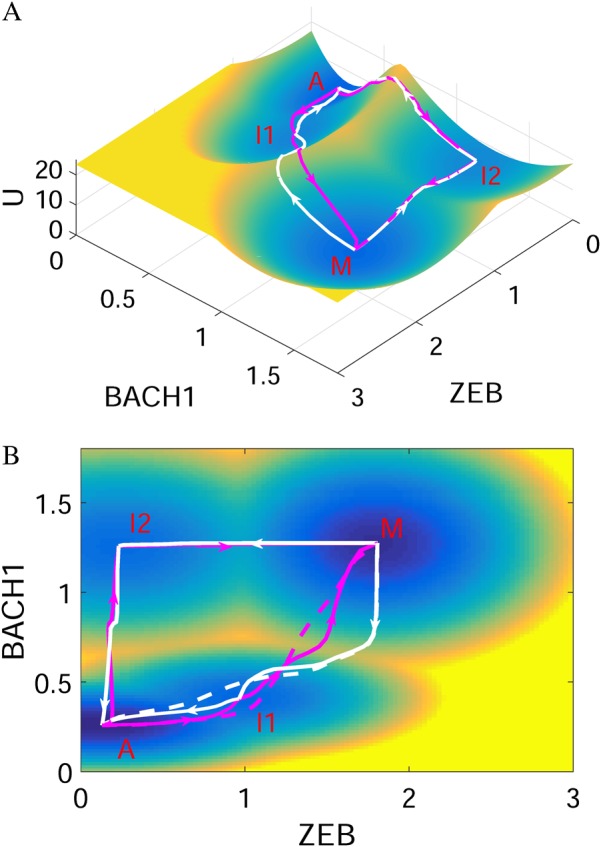
Fig. 2.

The landscape and corresponding minimum action paths (MAPs) for the EMT-metastasis network are shown in three-dimensional (a) and two-dimensional figures (b). Magenta solid lines represent the MAP from A state (anti-metastatic cell state) to I states, and to M state (metastatic cell state), and the white solid lines represent the MAP from M to I, and to A state. The dashed lines represent the direct MAP from A to M and from M to A states, respectively. A: anti-metastatic state, M: metastatic state, I1, I2: intermediate state. Here, ZEB and BACH1 are selected as the two coordinates
