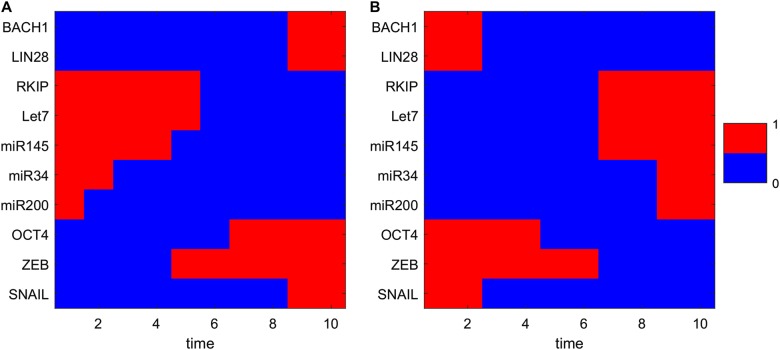
Fig. 3.
Transition path from A state to M state (a corresponding to the metastatic progression) and from M state to A state (b corresponding to the anti-metastatic progress) in terms of expression levels of 10 different genes. The relative gene expressions are discretized to 0 or 1. 1 represents that the corresponding genes are in the on (activated) state and 0 represents that the corresponding genes are in the off (repressed) state. X-axis shows the 10 time points along the transition path

