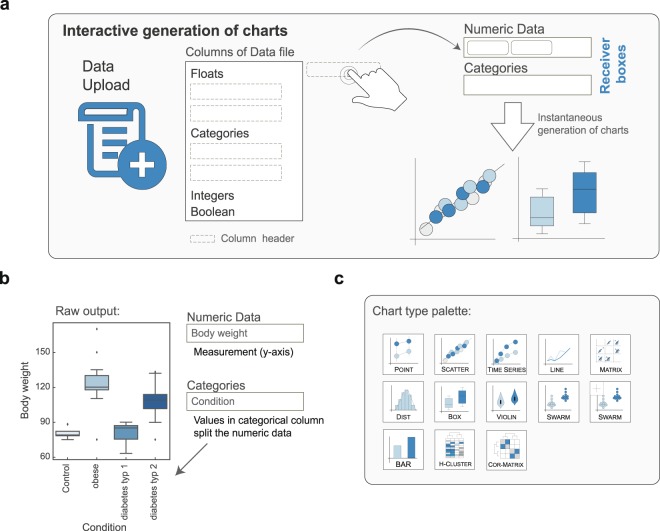
Figure 1.
Instant Clue allows on-the-fly inspection of data. (a) Schematic workflow of interactive chart generation by drag & drop. Upon data-upload the column headers are displayed in a tree-like view and separated according to their data type. The two receiver boxes can accept column headers and trigger data visualization. (b) Raw output of two drag & drop steps. The displayed data are from the accompanied Tutorial_Data_1.xslx file that can be found in the install directory. (c) Available chart type palette.

