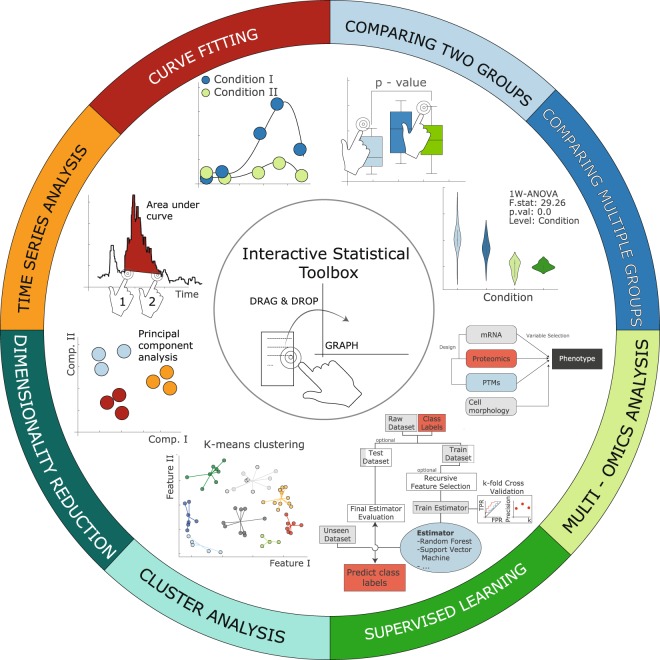
Figure 3.
Statistical Toolbox. Description clockwise starting from top-right. The statistical toolbox offers functionality to compare two-groups using non-parametric and parametric tests (e.g. t- and U-test) or multiple groups (ANOVA, Kruskal Wallis). Up to a three-way ANOVA design is available with and without repeated measurements (top-right). To integrate multiple omics data, users can use method such as sparse generalized canonical correlation analysis (SGCCA)35 to select features such as genes, proteins, miRNAs that strongly contribute to the multi-omics signature (right). A comprehensive toolbox for supervised learning has been implemented using the scikit-learn library allowing the user to set up pipelines with data-preprocessing, feature selection and prediction (bottom). Moreover, principal component analysis and cluster analysis can be initialized by one simple drag & drop event. Time series data can also be explored and techniques such as base line correction and measuring the area under curve (AUC) are implemented in an interactive way. (top-left) Row-wise curve fitting as well as correlation-based analysis can be performed in a customizable and versatile way. Due to its diversity and complexity all functions cannot be described here and further information and examples can be found at: https://www.instantclue.uni-koeln.de.

