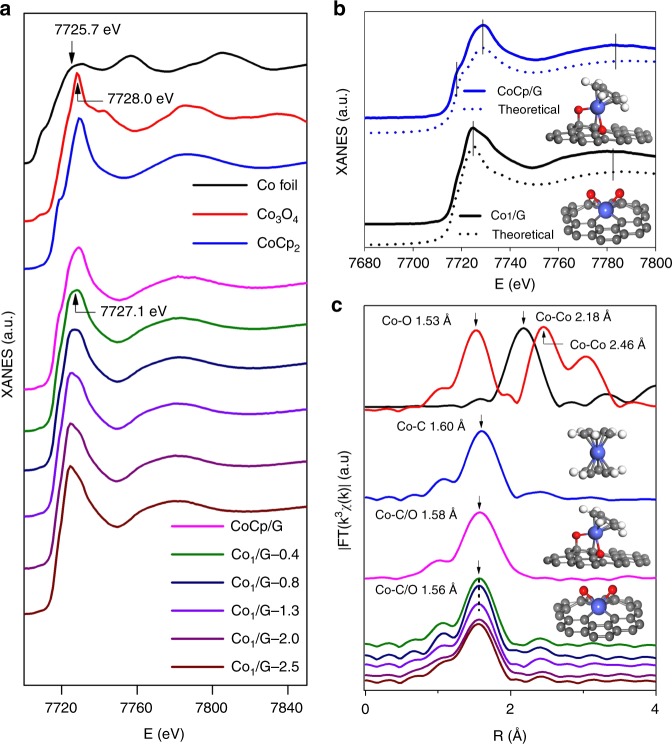
Fig. 3.
Co K-edge XAFS and EXAFS spectra of CoCp/G, Co1/G SACs. a Co K-edge XAFS spectra. b The experimental XANES curves are compared with the calculated XANES data of optimized DFT-modeled structures of Co1/G and CoCp/G (inset shows the atomic structures of the models). c Fourier transform (FT) extended x-ray absorption fine structure (EXAFS) of these samples with the corresponding structures (insets). The balls in gray, white, red, and blue represent carbon, hydrogen, oxygen, and cobalt, respectively. The Co K-edge XAFS and EXAFS spectra of Co foil, Co3O4 and CoCp2 samples are displayed for comparison. Note: the figure legend in a also applies to c

