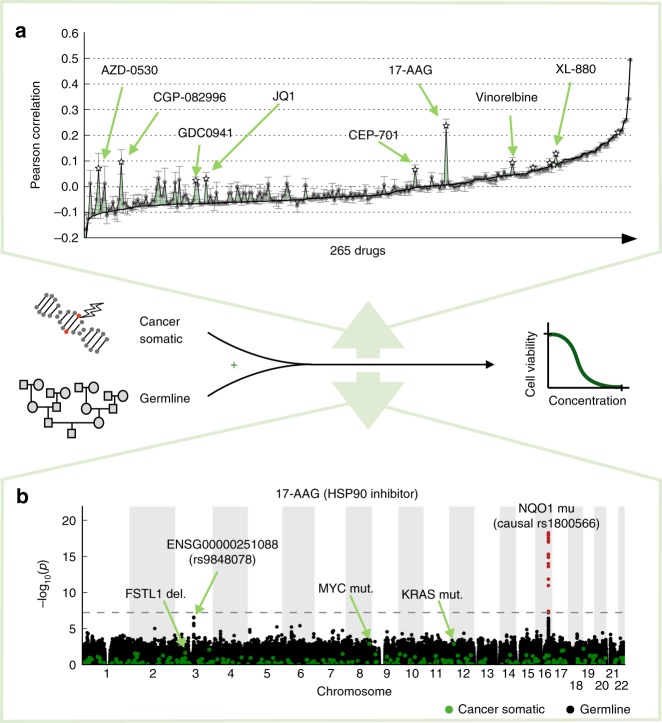
Fig. 1.
Illustration of the joint analysis approach considering germline variants and somatic mutations. a Prediction of drug susceptibility, either exclusively considering somatic mutations (baseline, black line) or considering the combination of germline variants and somatic mutations (green). Shown is out-of-sample prediction performance measured by the Pearson correlation coefficient between predicted and observed drug susceptibility profiles (quantified as 1-AUC; Methods). Error bars show standard deviations across analysis repetitions of the difference of Pearson correlation coefficients from the compared models (Methods, Supplementary Note 1). Selected drugs with large improvements of prediction performance when accounting for germline variants are highlighted. b Illustration of a joint genome-wide association analysis, considering associations between somatic mutations (green) or germline variants (black) and drug susceptibility for 17-AAG. Germline variants with genome-wide significant associations are highlighted in red (FWER < 0.05, dashed horizontal line)

