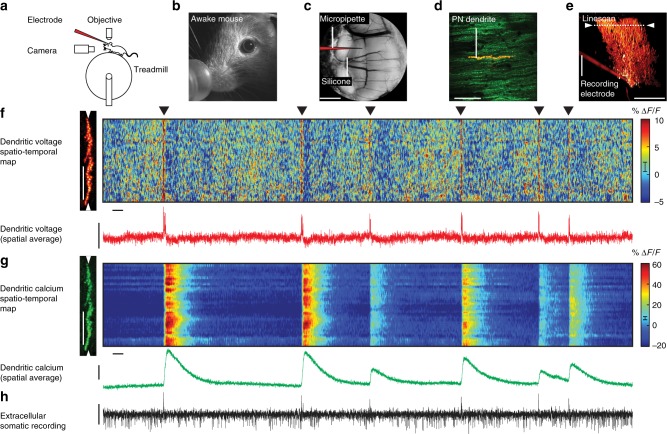
Fig. 1.
Simultaneous dendritic voltage and calcium imaging and somatic recording from Purkinje neurons in awake mice. a Experiments were performed on headfixed mice, alert and resting on a rotating treadmill. b A behaviour camera was used to monitor spontaneous movement in alert resting mice. c A cerebellar chronic cranial window with access port was used to label and record from single PNs in lobule V of the vermis. Scale bar 1 mm. d 2P image of distal PN spiny dendrites labelled with voltage sensitive dye ANNINE-6plus (red) and genetically encoded calcium indicator GCaMP6f (green), resulting in double labelling (yellow). Scale bar 100 μm. e Reconstruction of a single labelled PN showing position of 2P linescan (white arrows) and extracellular electrode placed at the soma. Scale bar 100 μm. f Spatiotemporal map obtained from 5 s of linescan recording (with 5 ms and 5 μm boxcar filtering) show spontaneous dendritic voltage signals. Filled triangles indicate dendritic complex spikes (DCS). Subthreshold dendritic voltage modulation is also visible in the spatiotemporal voltage map. Vertical scale bar 50 μm; horizontal scale bar 100 ms. Red trace shows spatially averaged voltage, recorded at 2 kHz resolution. Vertical scale bar 20% ΔF/F. g Corresponding spatiotemporal map for dendritic calcium. Vertical scale bar 50 μm; horizontal scale bar 100 ms. Green trace shows spatially averaged calcium. Vertical scale bar 20% ΔF/F. h Corresponding extracellular recording (black trace) showing somatic CS and SS events (positive and negative going events respectively). Vertical scale bar 100 pA. Error bars in colour maps show estimates for shot noise

