Fig. 2.
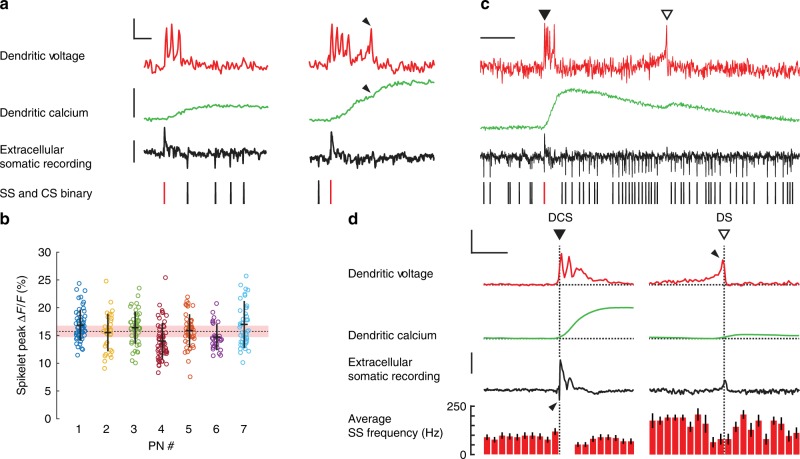
Two types of rapid and variable suprathreshold signals detected in spiny dendrites of awake mice. a Examples of dendritic complex spike (DCS) events (selected from Fig.1f) showing voltage (top red traces; vertical scale bar 10% ΔF/F, corresponding to about 21 mV; horizontal scale bar 5 ms), calcium (middle green traces; vertical scale bar 40% ΔF/F), and the corresponding extracellular somatic recording (bottom black trace; vertical scale bar 100 pA). Somatic binary signal showing SSs (black bars) and CSs (red bars). Black arrows indicate a late spikelet and a corresponding increment in calcium. b Amplitudes of the initial spikelets from all DCS recorded from 7 PNs (318 DCS in total), mean ± s.d. shown for each PN, group mean shown by dashed line and the pink bar shows error due to shot noise. c An example of a single dendritic spike (DS) event (open triangle) following a DCS event. Scale bar 50 ms. d Average dendritic voltage (vertical scale bar 10% ΔF/F; horizontal scale bar 25 ms), calcium (vertical scale bar 20% ΔF/F) and extracellular somatic recording (vertical scale bar 50 pA), and SS frequency (in 5 ms bins) from 49 DCS events (left) and 13 DS events (right) recorded from the same PN. Note the high SS firing rate surrounding (but not during) the DS events and the lack of a corresponding somatic action potential (downward going spike) in the somatic recording during DS events, in c and d. Black arrows indicate the onset of DCS and DS events. Bars show mean ± s.e.m

