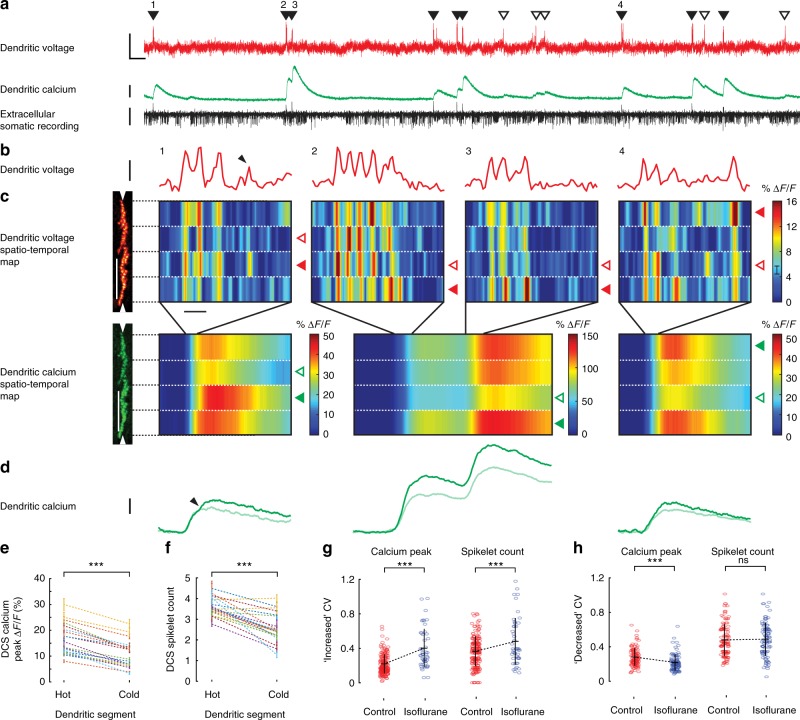
Fig. 3.
Suprathreshold dendritic complex spikes reveal high spatiotemporal variability in voltage and calcium signalling. a Simultaneous dendritic voltage and calcium and somatic recordings made from an awake mouse, with DCS and DS events indicated by filled and open triangles respectively. Voltage vertical scale bar 20% ΔF/F; calcium vertical scale bar 30% ΔF/F; extracellular somatic recording vertical scale bar 100 pA; horizontal scale bar 250 ms. b Four DCS examples (numbered in a) showing spatial average of dendritic voltage (red traces). Vertical scale bar 10% ΔF/F, corresponding to about 21 mV; horizontal scale bar 5 ms. c Corresponding spatiotemporal maps for voltage (vertical scale bar 50 μm; horizontal scale bar 5 ms), and calcium (vertical scale bar 50 μm; horizontal scale bar 50 ms) recorded from four dendritic segments (1 ms temporal filtering for voltage and 10 ms temporal filtering for calcium). Filled and open triangles (voltage; red, calcium; green) in all DCS examples indicate the hottest and coldest dendritic segments respectively, based on the peak calcium elevation and d shows the corresponding calcium traces from the hottest (dark green traces) and coldest (light green traces) segments. Vertical scale bar 20% ΔF/F. Black arrows in the first DCS example show a late voltage spikelet confined to a single dendritic segment in b and a corresponding calcium increment in (c) from the same dendritic segment. e DCS calcium peaks and f corresponding DCS spikelet counts in hot and cold dendritic segments, recorded from 20 PNs, paired two-tailed t test. DCS coefficients of variation (CV) between all four dendritic segments, for calcium peaks and spikelet counts in awake (control) and anaesthetized (isoflurane) conditions. CV data has been grouped for PNs showing g increased CV or h decreased CV during anaesthesia, unpaired two-tailed t test, ***p < 0.001, ns p > 0.05. Bars show mean ± s.e.m

