Fig. 4.
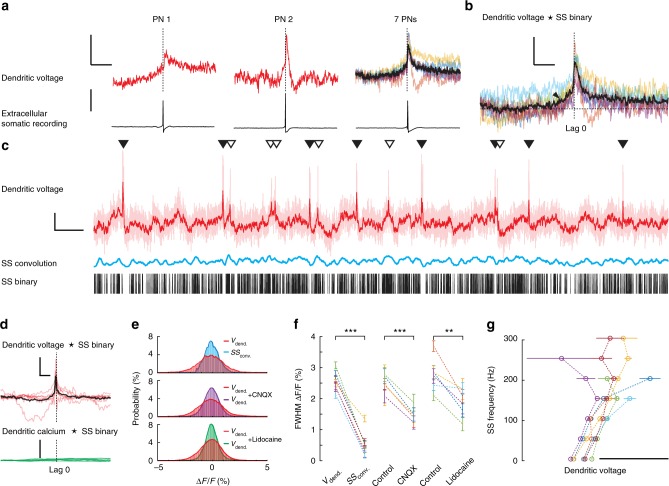
Subthreshold dendritic voltage reveals back-propagating action potentials and regimes of linear and nonlinear relationship with somatic activity. a Back-propagating action potentials (SS) recorded from PN spiny dendrites in awake mice, showing the most (left: 3614 averages) and least (middle: 1799 averages) attenuated signals recorded from different PNs, and signals from all seven PNs (right: black trace is group average). Voltage vertical scale bar 0.5% ΔF/F, corresponding to about 1 mV; extracellular somatic recording vertical scale bar 50 pA; horizontal scale bar 20 ms. b Cross-correlation (CC) between SS binary signal (recorded at the soma) vs. spiny dendrite membrane potential. Black arrow indicates dendritic depolarization preceding SS initiation. Vertical scale bar 0.5% ΔCC/CC; horizontal scale bar 10 ms. c 10 s of dendritic voltage recording, spatially averaged (light red trace). Dark red trace is dendritic voltage with 10 ms temporal filtering. Simultaneously recorded SSs are shown with binary (black bars), and corresponding convolution of back-propagating SS signal and SS binary (blue trace). Vertical scale bar 5% ΔF/F; horizontal scale bar 500 ms. d Normalized cross-correlations between filtered dendritic voltage and SS binary traces (red traces, black trace is group average; vertical scale bar 3% ΔCC/CC; horizontal scale bar 100 ms) and between corresponding dendritic calcium and SS binary traces (green traces; vertical scale bar 0.3% ΔCC/CC). e Normalized probability distributions of dendritic voltage (red) and SS convolution voltage (blue) calculated using all recordings from PN shown in c, (top); of dendritic voltage (red) and dendritic voltage during CNQX application (purple) calculated from a single PN (middle); and of dendritic voltage (red) and dendritic voltage during lidocaine application (green) calculated from a single PN (bottom); DCS and DS events were excluded. f Full width at half maximum (FWHM) of the corresponding dendritic voltage probability distributions measured from individual PNs (5−7 PNs per group), bars show mean ± s.d. of shot noise, paired two-tailed t test, ***p < 0.001, **p < 0.01. g Relationships between average dendritic voltage and somatic SS frequency recorded from seven PNs, calculated using a 20 ms kernel with 1 ms increments. Scale bar 5 mV. Bars show mean ± s.e.m

