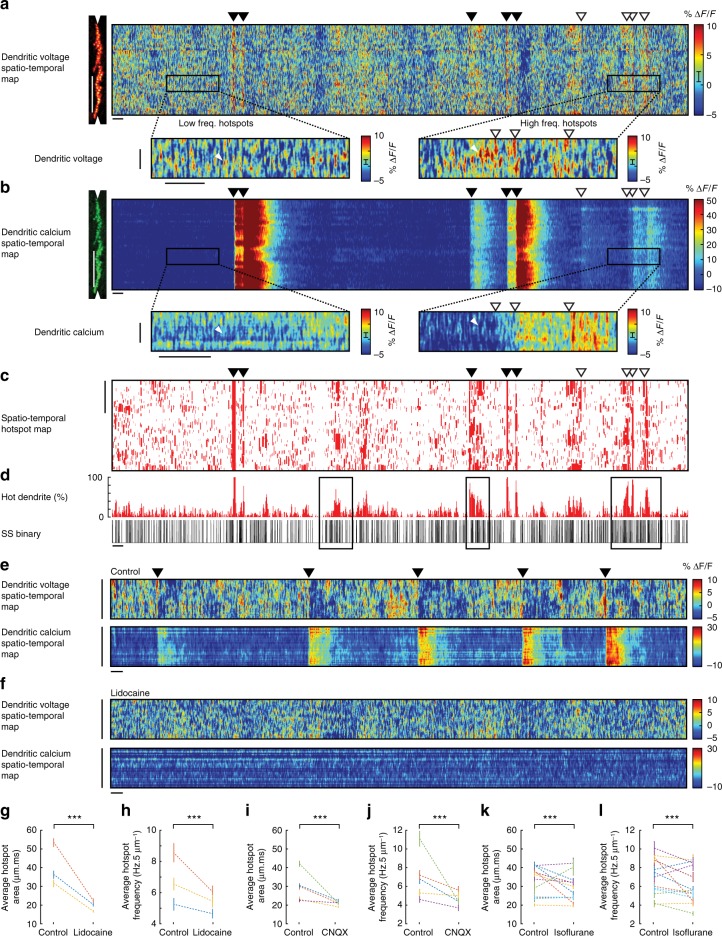
Fig. 5.
Voltage imaging reveals the spatiotemporal patterns of subthreshold hotspots in PN spiny dendrites of awake mice. a Spatiotemporal maps for voltage and b calcium recording from PN spiny dendrites. Vertical scale bar 50 μm; horizontal scale bar 100 ms. Inset boxes show examples of low and high hotspot activity in the voltage recording and the corresponding calcium recording (inset vertical scale bar 5 μm; horizontal scale bar 100 ms), white triangles indicate single hotspot events detected in the voltage map, but not in the calcium map. c Corresponding hotspot mask (hotspot ROIs from a) showing spatiotemporal hotspot map. Vertical scale bar 50 μm. d Percent of hot dendrite (5 ms bins) calculated from (c), and corresponding somatic SS binary trace (black bars), black boxes show epochs of high hotspot frequency and high SS frequency. Filled and open triangles throughout indicate DCS and DS events respectively. Horizontal scale bar 100 ms. e Spatiotemporal maps for voltage and calcium during awake (control) conditions and f following application of 0.2% lidocaine. Vertical scale bar 50 μm. Horizontal scale bar 100 ms. Average hotspot area and frequency in control conditions and following pharmacological manipulation by g, h lidocaine (3PNs), i, j CNQX (5 PNs), and k, l during anaesthesia by isoflurane (13 PNs), paired two-tailed t test, ***p < 0.001. Bars show mean ± s.e.m

