Fig. 6.
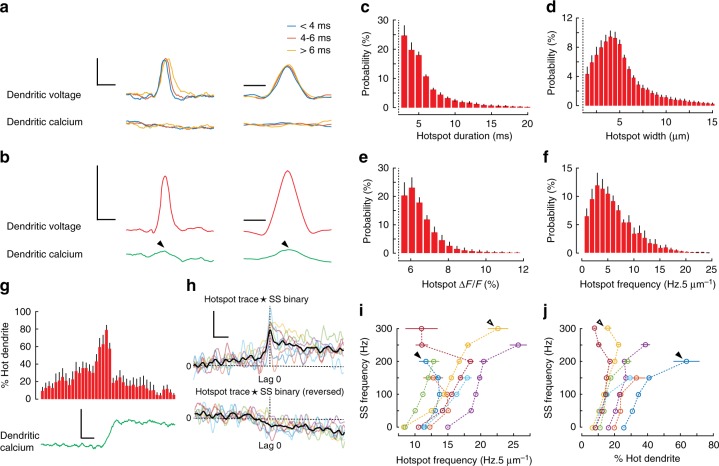
Rapid and localized subthreshold dendritic voltage hotspots show nonlinear relationships with dendritic calcium and somatic output. a Averaged isolated hotspots (216 in total, single PN) showing profiles of voltage (top traces) and calcium (bottom traces) (vertical scale bar 5% ΔF/F, corresponding to about 11 mV) in the temporal dimension (left traces; horizontal scale bar 10 ms) and the spatial dimension (right traces; horizontal scale bar 5 μm), grouped based on temporal duration of their ROIs. b Averaged isolated hotspots (1534 in total) showing profiles of voltage (top traces) and calcium (bottom traces) from all seven PNs (vertical scale bar 5% ΔF/F, corresponding to about 11 mV) in the temporal dimension (left; horizontal scale bar 10 ms) and the spatial dimension (right; horizontal scale bar 5 μm). Probability distributions for c the duration, d width, e amplitude and f frequency of all detected hotspots from seven PNs. g Average hotspot activity (percent hot dendrite in 5 ms bins) and average dendritic calcium (green trace; vertical scale bar 5% ΔF/F; horizontal scale bar 20 ms) during 13 DS events from a single PN. h Cross-correlations from all PNs, showing temporal relationship between hotspot traces and SS traces (top coloured traces), and cross-correlations from the same PNs, using reversed hotspot input traces (bottom coloured traces), thick black traces show group averages (vertical scale bar 0.1% ΔCC/CC; horizontal scale bar 20 ms). i Relationships between hotspot frequency (Hz/5 μm) and SS frequency for seven PNs and j the corresponding relationship between percent hot dendrite and SS frequency, calculated using a 20 ms kernel with 1 ms increments. Bars show mean ± s.e.m

