Fig. 3.
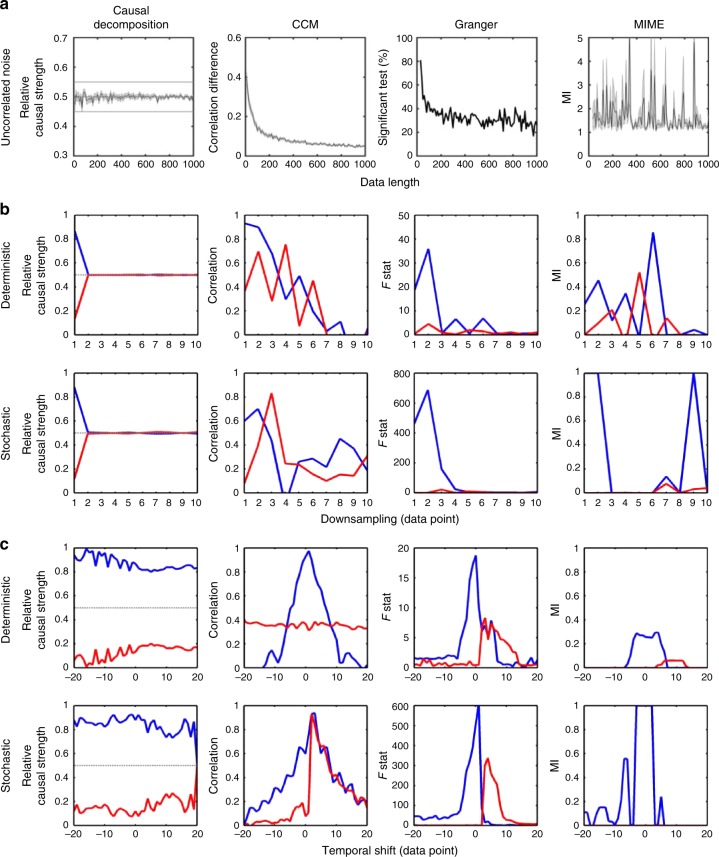
Validation of causal-decomposition method. a The finite length effect on causality assessment. We generated 10,000 pairs of uncorrelated white noise time-series observations with varying lengths (L = 10–1000) and calculated causality based on causal decomposition, convergent cross mapping (CCM), Granger causality, and mutual information from mixed embedding (MIME) method20. Causal decomposition exhibited a consistent pattern of causal strengths at 0.5 (the shaded error bar denotes the standard error of causality assessment here and in the other panels), indicating that no spurious causality was detected, whereas spurious causality was observed in the CCM, Granger’s causality, and MIME method. b Effect of down-sampling on the various causality methods. The stochastic and deterministic models shown in Fig. 2 are used (the corresponding colour for each variable is shown in the figure). The time series were down-sampled by a factor 1 to 10. The down-sampling procedure destroyed the causal dynamics in both models and made causal inference difficult in predictive causality analysis19. Causal-decomposition analysis revealed a consistent pattern of the absence of causality when the causal dynamics were destroyed as the down-sampling factor was >2. c Effect of temporal shift on the various causality methods. Temporal shift (both lagged or advanced up to 20 data points) was applied to both the stochastic and deterministic time series. Causal decomposition exhibited a stable pattern of causal strength independent of a temporal shift up to 20 data points, while the predictive causality methods are sensitive to temporal shift

