
FIGURE 2.
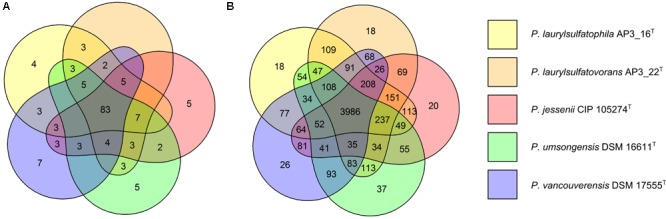
Comparison of biochemical, physiological and genomic potential of the five Pseudomonas strains. Venn diagrams based on: (A) the results of the physiological and biochemical tests for the five analyzed strains, the number of main features differentiating the strains are presented on the diagram; (B) the number of identified orthologous clusters between the genomes of the five compared strains. The numbers indicate the identified unique or shared orthologs between the strains.