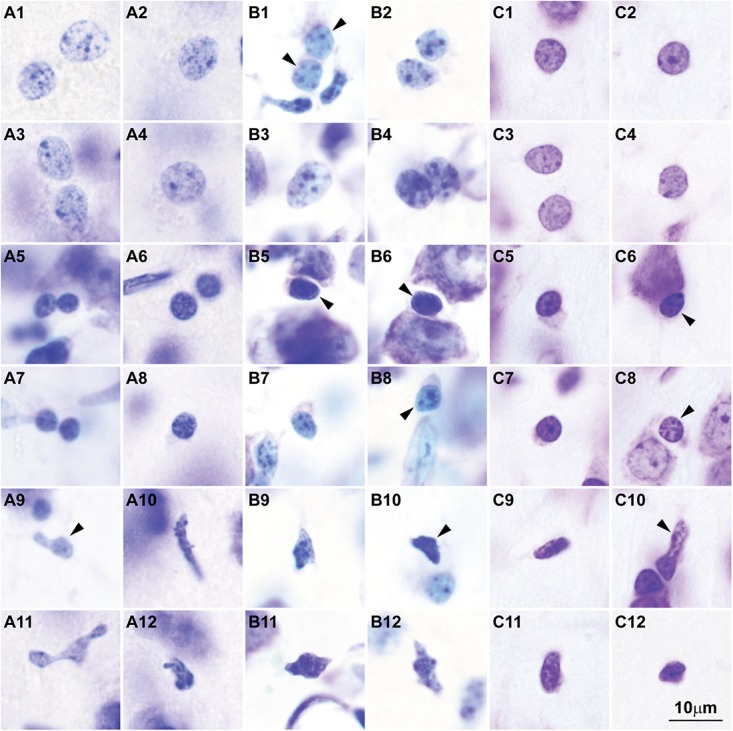
FIGURE 3.

Nuclear chromatin patterns and nuclear sizes of glial cells in the cerebral cortex shown by Nissl are comparable across primate and non-primate species. (A1–A12) Photomicrographs of human astrocytes (A1–A4), oligodendrocytes (A5–A8), and microglial cells (A9–A12). (B1–B12) Micrographs of rhesus macaque astrocytes (B1–B4), oligodendrocytes (B5–B8), and microglial cells (B9–B12). (C1–C12) Micrographs of rat astrocytes (C1–C4), oligodendrocytes (C5–C8), and microglial cells (C9–C12). Arrowheads in panels showing more than one glial cell type point to astrocytes (B1), oligodendrocytes (B5,B6,B8, C6, C8), and microglial cells (A9, B10, C10). Calibration bar in (C12) applies to all panels. (A1–A12) and (B1–B12) of this figure are a reexamination of material form an earlier paper (Zikopoulos et al., 2018); (C1–C12) are a reexamination of material form a gift of Dr. Alan Peters.
