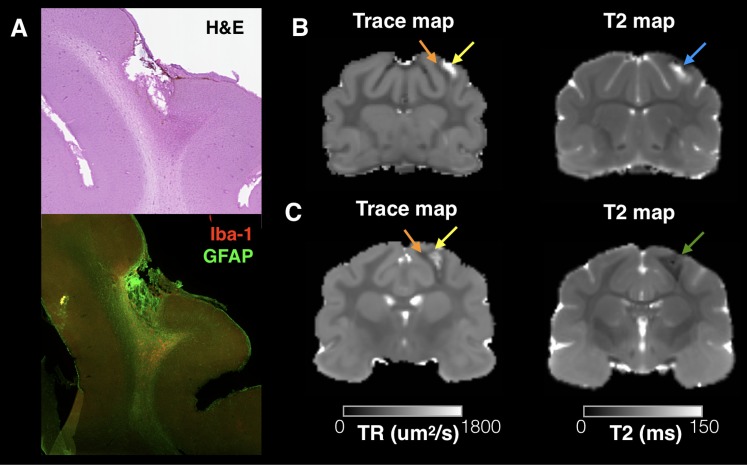
FIGURE 3.
Trace and T2 abnormalities report different information about the tissue environment related to small focal cavitation. Regions of abnormally high T2 and Trace were observed in a subset of brains in this study that corresponded with small focal cavitations surrounded by glial scarring evident by H&E staining and IHC for Iba-1 and GFAP (A). Examples are shown from two brains taken 4 and 12 weeks after CCI (B,C), which demonstrate a consistent pattern of increased Trace in the cavity region (yellow arrows) and reduced trace in the surrounding region of glial scarring (orange arrows). T2 abnormalities were also abnormal near this pathology, but followed a different spatial pattern than Trace in each brain and with different T2 values across brains indicated by a blue arrow (B, increased T2) or green arrow (C, decreased T2).

