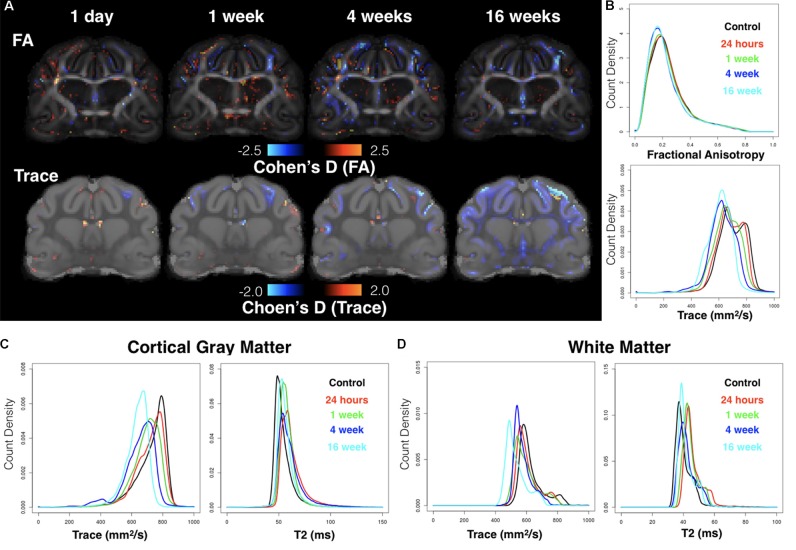
FIGURE 6.
Whole-brain analysis using voxelwise effect size maps and DTI metric histograms. Cohen’s D maps for FA and Trace are shown at the same slice level for each group according to time after CCI (A) where voxels with increased or decreased DTI values as compared with the control group are indicated by warm and cool colors respectively. Whole-brain histogram analysis (B) of FA and Trace values from the average template brain maps for each group are shown as well as Trace and T2 histograms for cortical gray matter (C) and whole brain white matter (D).

