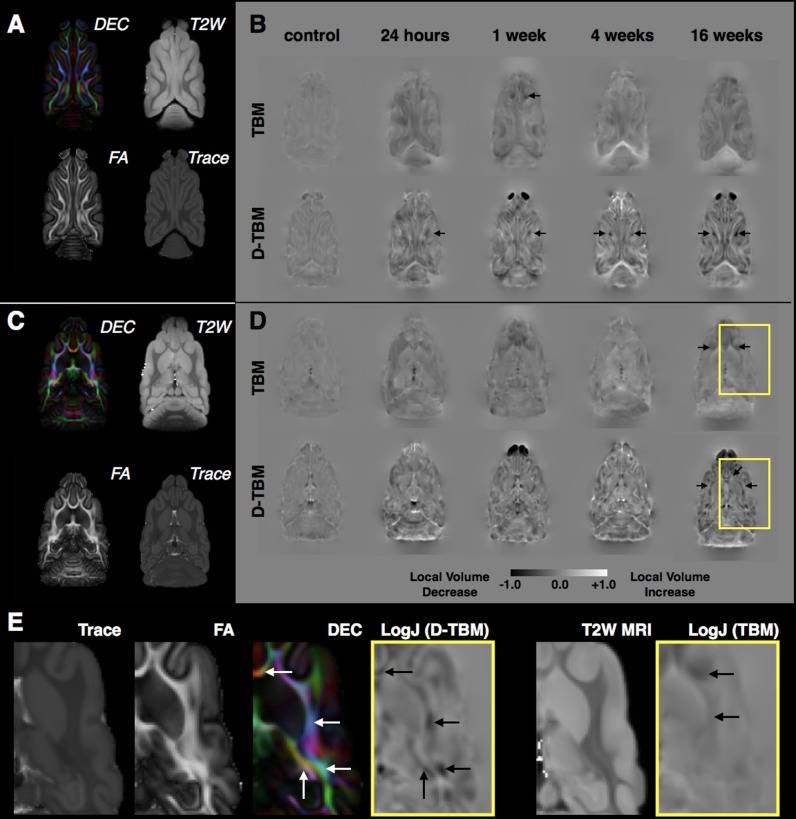
FIGURE 8.
Tensor-based morphometry analysis of local volume changes following mCCI. For both a dorsal slice near to the CCI site (A,B) and a more ventral slice distant from the CCI site (C,D), DTI maps from the control template are shown for reference (A,C) and group averaged LogJ maps generated from conventional TBM using structural MRI registration and D-TBM using DTI-based registration are shown for each experimental group (B,D) with the same window scaling as indicated in the scale bar at bottom. Black arrows indicate regions of reduced volume, which are more apparent by D-TBM analysis and most prominent near to the CCI site during the acute period but found to be bilateral and widespread during the chronic period. Closer examination of D-TBM LogJ maps from 16 weeks after mCCI (E) reveals several regions of white matter (WM) volume reduction (black arrows, D-TBM) that are localized to particular tracts within the lager body of WM discernable by their orientation on DEC maps (white arrows) compared with homogeneous contrast on scalar maps (Trace, FA, and T2W MRI) resulting in less focal or absent conventional TBM findings (black arrows, TBM).

