FIGURE 2.
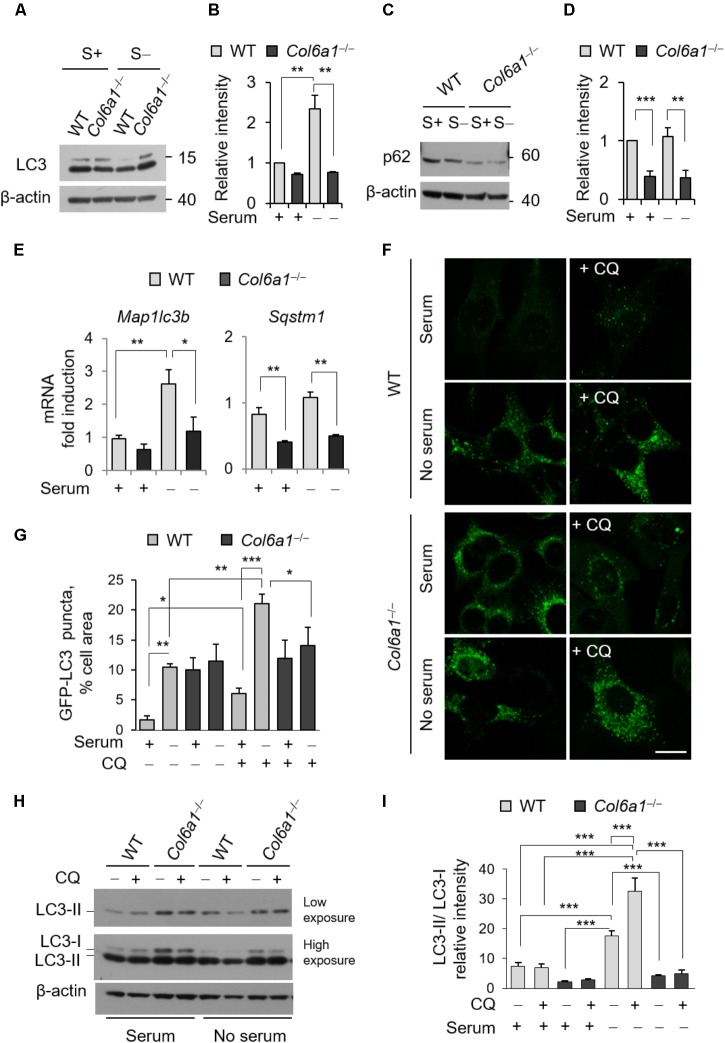
The autophagic flux is impaired in Col6a1-/- fibroblasts. (A–D) Western blot analysis of LC3 and p62 in total cell extracts from WT and Col6a1-/- fibroblasts in complete medium (S+) or following serum withdrawal for 3 h (S–). (B,D) Show respectively the LC3-II/LC3-I ratio (B) and the p62/β-actin ratio (D), as determined by densitometric quantification of the western blots as in (A,C). Values for WT fibroblasts in complete medium were arbitrarily set to 1. Data represents the mean of at least three independent experiments. (E) qRT-PCR analysis of Map1lc3b and Sqstm1 mRNA levels. Data represents the mean of at least three independent experiments. (F) Fluorescence microscopy detection of LC3-positive puncta in WT and Col6a1-/- fibroblasts derived from Col6a1+/+::GFP-LC3 and Col6a1-/-::GFP-LC3 mice, respectively, and maintained in complete medium or subjected to serum starvation for 3 h. LC3 puncta (autophagosomes) accumulate in Col6a1-/- fibroblasts both in complete medium and serum starved conditions. Scale bar, 25 μm. (G) Quantification of GFP-LC3 puncta per cell area, as shown in (F). (H) Western blot analysis of total cell extracts from WT and Col6a1-/- fibroblasts in complete medium (S+) or following serum withdrawal for 3 h (S–). The autophagic flux, as determined by the analysis of LC3 lipidation in the absence or presence of 50 μM CQ treatment, is shown. (I) Densitometric quantification of the relative intensity of LC3-II/LC3-I ratio of three independent western blot experiments, as in (H). Data were analyzed by ANOVA test with Bonferroni correction. ∗P < 0.05; ∗∗P < 0.01; ∗∗∗P < 0.001.

