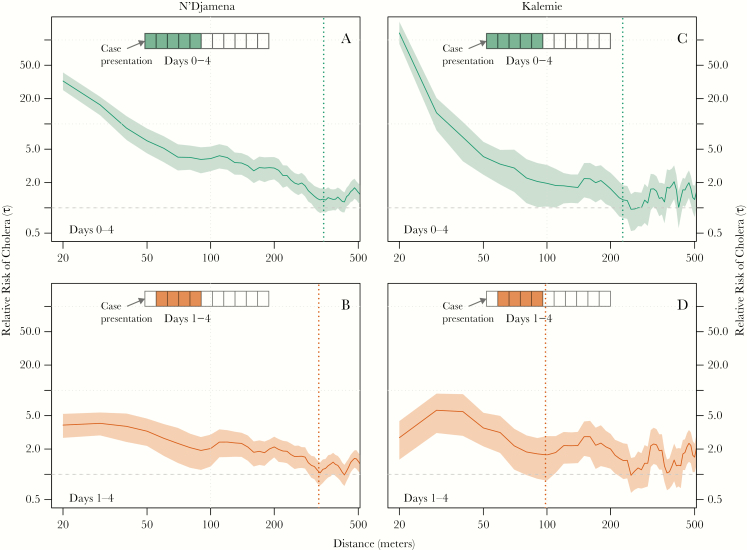
Figure 1.
Estimates of the relative risk of the next cholera case being within a specific distance to another case (x-axis) within either days 0–4 (green, A and B) or days 1–4 (orange, C and D) compared with the risk of the case occurring anywhere in the population. Dashed lines represent the spatial extent of the zones of increased risk as defined by the first point at which the 95% confidence intervals cross unity over a 20-meter interval (ie, over 2 consecutive 10-meter points).

