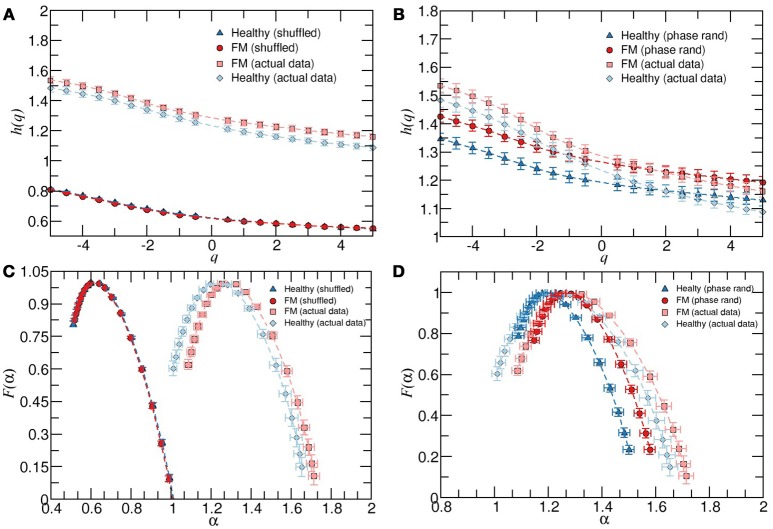
Figure 3.
(A) Average behavior of h(q) vs. q for healthy subjects, patients with FM and their corresponding shuffled version. (B) As in (A) but for the phase randomized data. The exponents were calculated for the scaling region 6 < s < 100. (C) Multifractal spectrum F(α) vs α for healthy and FM groups and their corresponding shuffled version. (D) As in (C) but for the phase randomized data, all during timeday. Error bars represent the standard error of the mean.

