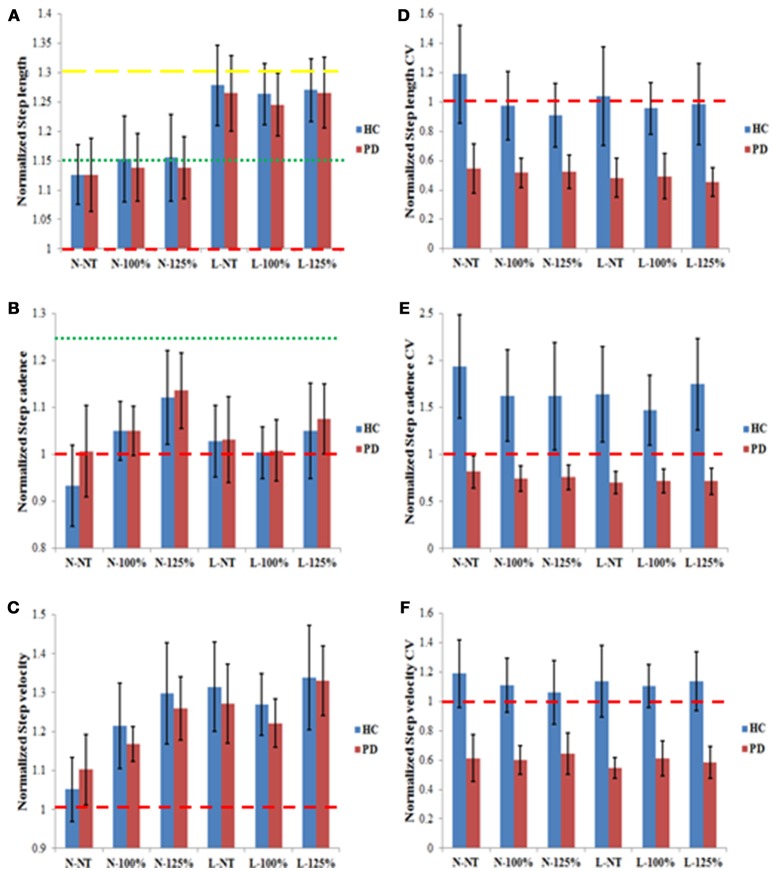
Figure 3.
Normalized results for step length (A), step cadence (B), step velocity (C), step length CV (D), step cadence CV (E), and step velocity CV (F) for the PD and the HC groups in the six different experimental conditions. The results are presented as normalized results calculated as the values obtained divided by the corresponding individual baseline values. Values >1 indicate an increase relative to baseline; values < 1 indicate a decrease relative to baseline. The red dashed lines in all graphs represent the value that would indicate no difference from baseline measures (1). In (A) the green and yellow dashed lines represent the step length prescribed in the N and L conditions, respectively. In (B) the dashed red and the green lines represent the step cadence prescribed in the 100 and 125% conditions, respectively. The error bars represent the confidence intervals (95%) of the mean.

