Figure 5.
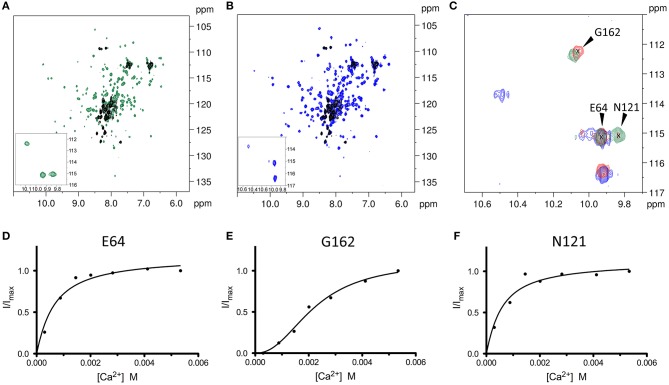
1H-15N HSQC NMR spectra of WT CIB2 in its apo form and in the presence of Mg2+ and Ca2+ highlight an allosteric communication between E64 and N121. (A) Superimposition of the two-dimensional 1H-15N HSQC NMR spectra of the apo- (black), and Ca2+-bound (green) 15N-WT CIB2. (B) Superimposition of the HSQC spectra of apo (black), and Mg2+-bound (blue) 15N-WT CIB2. In the insets, zoom of the HSQC spectra of the downfield peaks of the metal-bound forms of 15N-WT CIB2. Metal ions were present at a protein:metal ratio of 1:15. (C) Superimposition of downfield region of the 1H-15N HSQC NMR spectra recorded on 15N-WT CIB2 containing 15 equivalents of Mg2+ (blue), 15 eq Mg2+ + 15 eq Ca2+ (red), and 15 eq Ca2+ (green). (D–F) Variation of 1H-15N HSQC peak intensities of WT CIB2 as a function of Ca2+ concentration. The peak intensities were normalized with respect to the maximum value. The continuous lines represent the data fitted against equations as indicated in section Materials and Methods. The plots refer to the amide peaks of residues E64 (D), G162 (E), and N121 (F). All the spectra were recorded at 600 MHz and 25°C. All samples were at protein concentration of 320 μM in 20 mM Hepes, 100 mM KCl, 1 mM DTT, pH 7.5.

