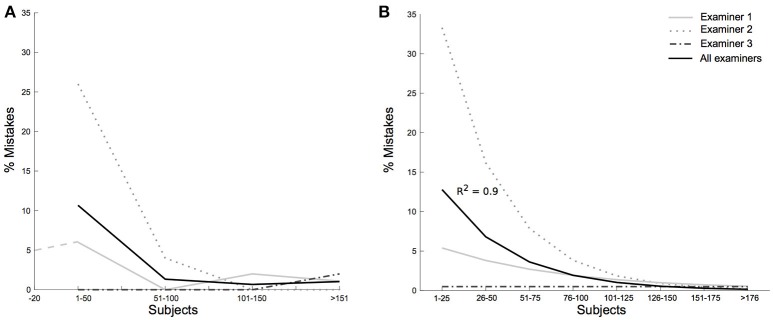
Figure 4.
Restrictive mistakes per examiner and individual learning curves. (A) Shows the rate of restrictive mistakes for the individual examiners (gray lines) and the cumulative rate (black line) with participants grouped in chunks of 50. After the first 50 tested participants per examiner the rate of restrictive mistakes decreased from 10% (15/150) to 1.3% (7/530). Examiner 1 participated in a pilot study, represented in a dashed line. (B) Shows exponential fits for each of the three examiners. Participants were grouped in chunks of 25. The decrease of non-interpretable vHITs over the number of tested participants was estimated fitting the rate of mistakes with an exponential curve. Examiner 2 with most errors in the beginning of the study showed an R2 of 0.97 (examiner 1 R2 = 0.34, examiner 3 R2 = 0.00). The overall exponential fit for all examiners' restrictive mistakes resulted in an R2 of 0.90.

