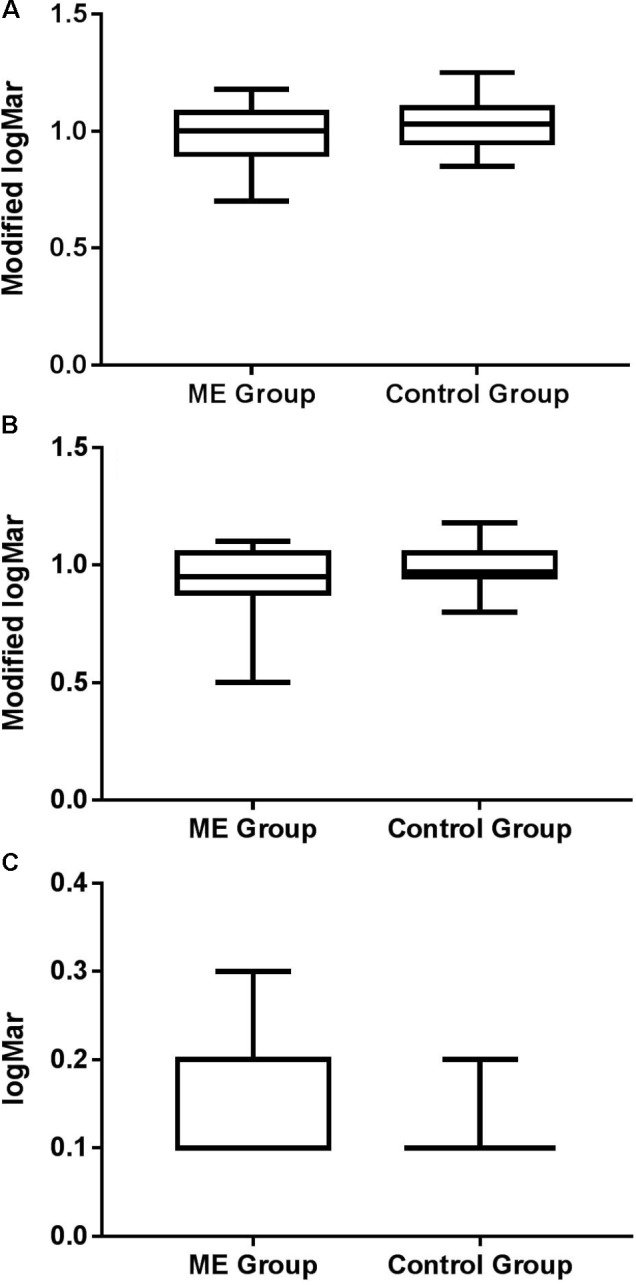
FIGURE 2.

Box and whisker plots showing minimum, 1st quartile, median, 3rd quartile, and maximum for (A) uncrowded and (B) crowded acuity for patients and controls, expressed as a modified logMAR score (1-logMAR) (c.f. McGraw and Winn, 1993; Simmers et al., 1999). Crowding ratios (crowded: uncrowded) were 1.35 for patients and 1.01 for controls, where higher values represent increased susceptibility to crowding. (C) Acuity for isolated words for each group.
