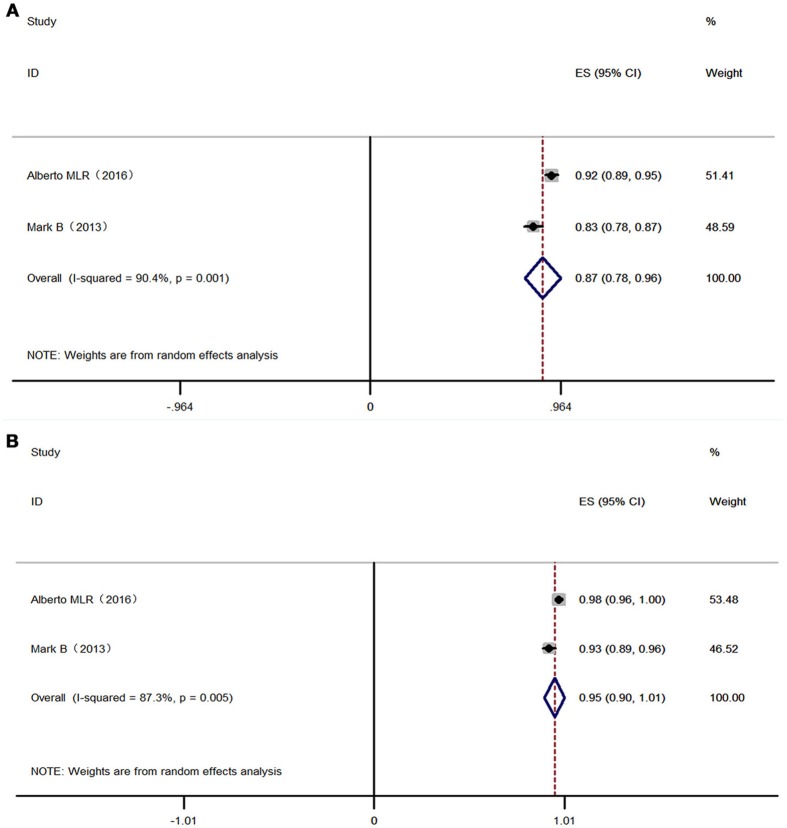
Figure 5.
Forest plot RAL plus LPV /r in virologic suppression. Each risk ratio represents the effect of the second-line treatment in people with HIV with previous ART failure. (A) Intention-to-treat analysis of HIV RNA <400 copies/mL. (B) Pre-protocal analysis of HIV RNA <400 copies/mL. RAL, Raltegravir; LPV /r, Ritonavir-boosted lopinavir.

