Figure 5.
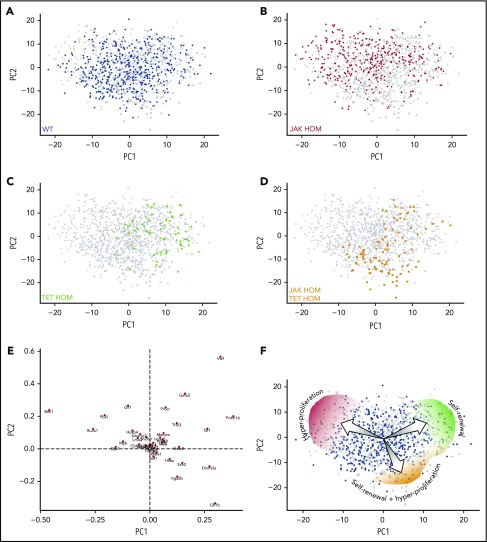
Single-cell gene expression profiling reveals distinct molecular clusters of single and double-mutant HSCs with altered self-renewal and proliferation. Cells from all 4 genotypes were assessed by single-cell multiplexed quantitative polymerase chain reaction; each PCA plot displays all single cells analyzed (with 1 population highlighted in each plot). (A-D) PCA displays on a single plot, HSCs from WT (n = 561, blue circles), JAK HOM (n = 376, red circles), TET HOM (n = 73, green circles), and JAK HOM TET HOM (n = 99, orange circles). Notably, WT cells are present across the entire molecular landscape, whereas single- and double-mutant HSCs are enriched in specific regions. (E) Loadings plot for PCA, indicating the key defining molecular features of each region, with the distance from the center indicating the negative correlation with a cell type (eg, cells in the top right lack Vwf). (F) Illustration depicting the different cell characteristics associated with each region of the molecular landscape.

